Figure 8
- ID
- ZDB-FIG-210725-93
- Publication
- Ma et al., 2021 - Matriptase activation of Gq drives epithelial disruption and inflammation via RSK and DUOX
- Other Figures
-
- Figure 1
- Figure 1—figure supplement 1.
- Figure 2
- Figure 2—figure supplement 1.
- Figure 3
- Figure 3—figure supplement 1.
- Figure 4
- Figure 4—figure supplement 1.
- Figure 5.
- Figure 6.
- Figure 7
- Figure 7—figure supplement 1.
- Figure 8
- Figure 8—figure supplement 1.
- Figure 9
- Figure 9—figure supplement 1.
- Figure 9—figure supplement 2.
- Figure 10
- Figure 10—figure supplement 1.
- Figure 11.
- All Figure Page
- Back to All Figure Page
|
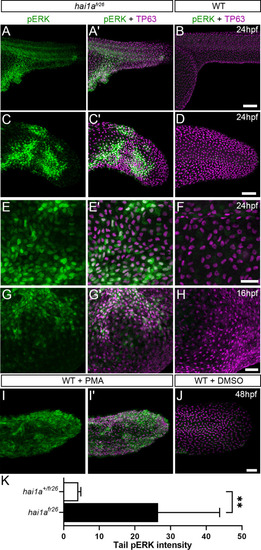
(A?L) Lateral projected confocal images of trunks (A, A?, B, E, E?, F), yolk surface (G, G?, H) and tails (C, C?, D, I, I?, J) of embryos immunostained for TP63 (A?, B, C?, D, E?, F, G?, H, I?, J; magenta) and pERK (A, J; green) at 24hpf (A?F), 16hpf (G?H), and 48hpf (I?J). Both hai1afr26 (A, A?, C, C?, E, E?, G, G?) and 125 ng/ml PMA-treated (I, I?) embryos show increased epidermal pERK levels compared to untreated WT (B, D, F, H, J). Elevation of epidermal pERK in hai1afr26 mutants and PMA- treated embryos is seen in the trunk (A, E) and tail (C, I) as well as in epidermis over the yolk prior to overt phenotype manifestation (G). (K) Quantification of pERK immunofluorescent intensity in the tail of 24hpf hai1afr26 larvae compared to siblings. n = 5; Mann?Whitney test; **p<0.01. Scale bars: (B) = 100 Ám; (D, H, J) = 50 Ám; (F) = 20 Ám. |

