FIGURE SUMMARY
Title

METTL3-dependent m6A modification of PSEN1 mRNA regulates craniofacial development through the Wnt/β-catenin signaling pathway

Authors
Ma, L., Zhou, X., Yao, S., Zhang, X., Mao, J., Vona, B., Fan, L., Lou, S., Li, D., Wang, L., Pan, Y.
Source
Full text @ Cell Death Dis.

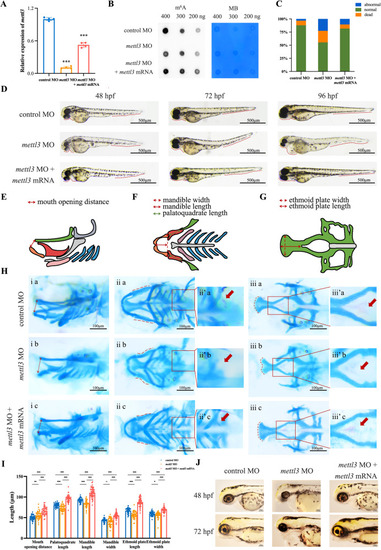
Phenotypes of the zebrafish.

A The expression of mettl3 in zebrafish embryos injected with control morpholino (MO), mettl3 MO, or co-injection with mettl3 MO and mRNA at 48 hpf. B Representative dot blot showing m6A levels in zebrafish embryos injected with control MO, mettl3 MO, or co-injection with mettl3 MO and mRNA. MB, methylene blue staining. C Statistical analysis of the number of dead, abnormal or normal embryos. D Lateral view of zebrafish larvae injected with control MO, mettl3 MO, or co-injection with mettl3 MO and mRNA that were imaged with transmitted light at 48, 72, and 96 hpf. EG Schematic diagram of zebrafish craniofacial cartilage structures, including the distance of mouth opening, width and length of the mandible, length of the palatoquadrate, and width and length of the ethmoid plate, from lateral view and ventral views. H Zebrafish embryos at 144 hpf were stained with alcian blue and alizarin red to observe craniofacial structures. The red arrow shows the development of tooth and pharyngeal in zebrafish embryos. I Scatter histogram showing the length of the palatoquadrate, Meckel’s cartilage, and the ethmoid plate; the width of Meckel’s cartilage and the ethmoid plate; and the distance of mouth opening in zebrafish embryos injected with control MO, mettl3 MO, or co-injection with mettl3 MO and mRNA (each group, n = 100). J Iridophores at 48 and 72 hpf in zebrafish embryos injected with control MO, mettl3 MO, or co-injection with mettl3 MO and mRNA. Results were presented as mean ± SD of three independent experiments. *P < 0.05, **P < 0.01 or ***P < 0.001 indicates a significant difference between the groups.

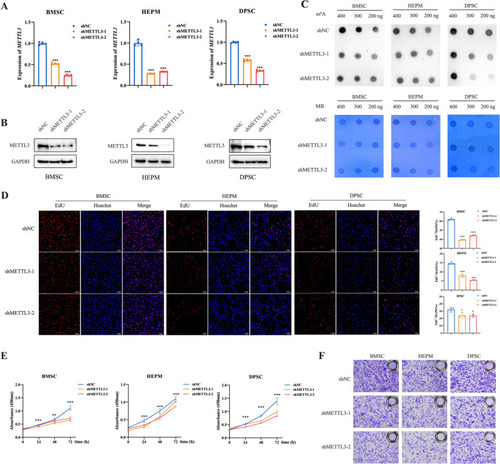
METTL3 knockdown significantly suppresses cell proliferation and migration in vitro.

A, B The efficiency of METTL3 knockdown in BMSCs, HEPM cells, and DPSCs. The expression of METTL3 was verified at both the mRNA and protein levels. C Representative dot blot showing the m6A levels in cells with METTL3 knockdown and control groups. MB, methylene blue staining. D, E Low METTL3 expression significantly reduced the proliferation rate of BMSCs, HEPM cells, and DPSCs. F Low METTL3 expression significantly reduced the migration ability of BMSCs, HEPM cells, and DPSCs. Results were presented as mean ± SD of three independent experiments. *P < 0.05, **P < 0.01 or ***P < 0.001 indicates a significant difference between the designated groups.

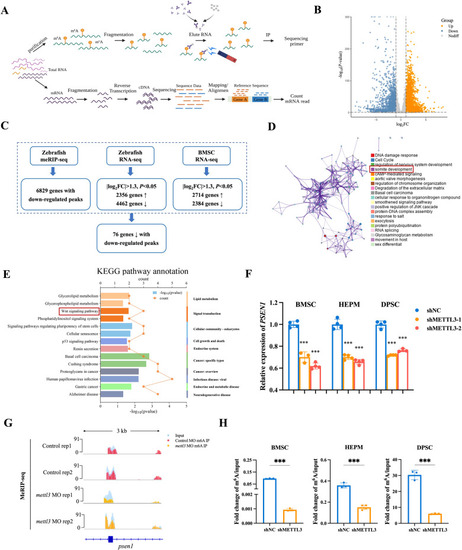
Identification of METTL3 targets via MeRIP-seq and RNA-seq.

A Schematic diagram depicting the protocols used for MeRIP-seq and RNA-seq. B Volcano plot of differentially expressed genes between METTL3 knockdown and control BMSCs. C Flow chart showing the shared downregulated genes with hypomethylated m6A peaks. D Gene enrichment analysis performed via the Metascape database. E KEGG pathway enrichment analysis shows major signaling pathways in METTL3-knockdown BMSCs compared to control BMSCs. F The expression level of PSEN1 in BMSCs, HEPM cells, and DPSCs in the METTL3-knockdown and control groups. G The m6A abundances of psen1 transcript in mettl3-knockdown zebrafish embryos compared to control embryos. H Validation of m6A modification in METTL3-knockdown and control cells using MeRIP-qPCR. Results were presented as mean ± SD of three independent experiments. *P < 0.05, **P < 0.01 or ***P < 0.001 indicates a significant difference between the groups.

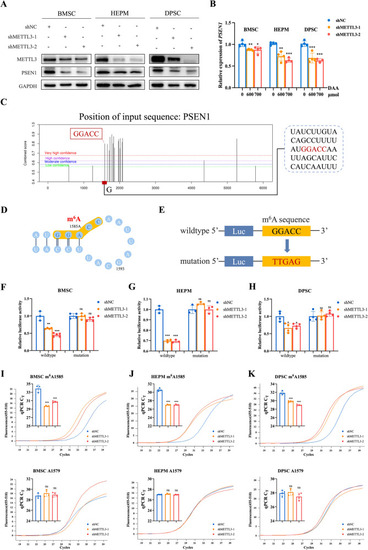
PSEN1 is modulated by METTL3-mediated m6A RNA methylation.

A The protein level of PSEN1 in BMSCs, HEPM cells and DPSCs with METTL3-knockdown and control groups. B The relative expression of PSEN1 detected at the RNA level after treatment with DAA in at various concentrations (0 μmol, 600 μmol and 700 μmol). C, D Potential m6A sites in full-length PSEN1 gene predicted using SRAMP. E The wild-type or mutant m6A consensus sequence fused with the firefly luciferase reporter. FH The transcription levels of wild-type and mutant PSEN1 in BMSCs, HEPM cells and DPSCs. IK The m6A methylation level of the PSEN1 at specific modification site (m6A1585) and control site (A1579) using SELECT in control and METTL3 knockdown cells. Results were presented as mean ± SD of three independent experiments. *P < 0.05, **P < 0.01 or ***P < 0.001 indicates a significant difference between the groups.

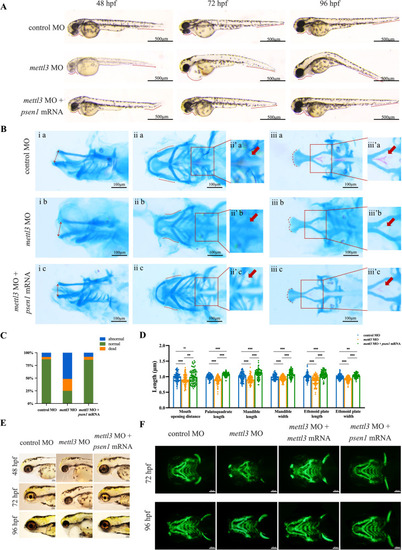
psen1 rescues the level of Sox10 associated with migrating zebrafish neural crest cells and abnormal craniofacial phenotypes.

A, B Co-injection of psen1 mRNA rescued the abnormal craniofacial phenotypes in mettl3-knockdown embryos. C Statistical analysis of the number of dead, abnormal, or normal embryos. D Scatter histogram showing the length of the palatoquadrate, Meckel’s cartilage, and the ethmoid plate; the width of Meckel’s cartilage and the ethmoid plate; and the distance of the mouth opening in zebrafish embryos injected with control MO, mettl3 MO, or co-injection with mettl3 MO and psen1 mRNA (each group, n = 100). E Iridophores at 48, 72, and 96 hpf in zebrafish embryos injected with control MO, mettl3 MO, or co-injection with mettl3 MO and psen1 mRNA. F Tg(sox10: eGFP) transgenic zebrafish embryos expressing green fluorescent protein (GFP) were used to explore the effects of mettl3 and psen1 during zebrafish embryogenesis. Results were presented as mean ± SD of three independent experiments. *P < 0.05, **P < 0.01 or ***P < 0.001 indicates a significant difference between the groups.

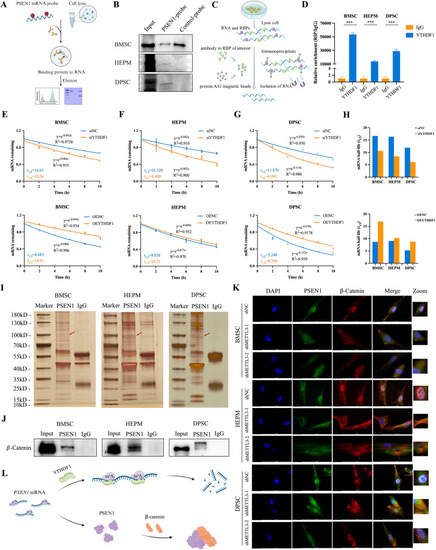
PSEN1 is specifically recognized by YTHDF1 and directly interacts with β-catenin.

A Schematic of the design for the RNA pull-down assay. B Immunoblotting of YTHDF1 after the RNA pull-down assay with cell lysate, biotinylated-PSEN1, and biotinylated-control in the cells. C Schematic of the design for the RNA immunoprecipitation (RIP) assay. D RIP assay to determine the enrichment of PSEN1 in cells incubated with anti-YTHDF1 antibody. EH Cells were transiently transfected with control, siYTHDF1, empty vector, or OEYTHDF1, respectively. The half-life (t1/2) of the PSEN1 mRNA was measured. I Silver staining revealed PSEN1-bound proteins in BMSCs, HEPM cells and DPSCs. J Interaction between β-catenin and PSEN1 determined by co-IP followed by western blot analysis. K Representative image showing the enrichment of PSEN1 and β-catenin after METTL3 knockdown by immunostaining analyses in BMSCs, HEPM cells, and DPSCs. L Schematic diagram showing the mechanism of PSEN1. Results were presented as mean ± SD of three independent experiments. ***P < 0.001 indicates a significant difference between the groups.

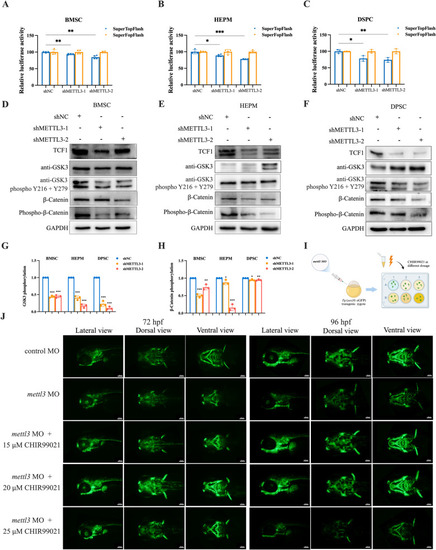
METTL3 deficiency inhibits Wnt/β-catenin signaling and Wnt/β-catenin activation partially alleviates the phenotypes of mettl3 morphants.

AC Dual luciferase assay demonstrating the effect of SuperTop/SuperFop reporter activity in BMSCs, HEPM cells, and DPSCs transfected with the shMETTL3 vector. DF Western blot showing the protein levels of TCF1, GSK3, phosphorylated-GSK3, β-catenin, and phosphorylated-β-catenin in control and stable METTL3 knockdown cells, GAPDH was used as a loading control. G, H Quantitative analyses of the relative expression of phosphorylated GSK3 and β-catenin. I Schematic of the experimental design to assess the effect of CHIR99021 at different doses. J Wnt/β-catenin activation partially alleviates the phenotypes of mettl3 morphants. Results were presented as mean ± SD of three independent experiments. *P < 0.05, **P < 0.01 or ***P < 0.001 indicates a significant difference between the groups.

Acknowledgments
This image is the copyrighted work of the attributed author or publisher, and ZFIN has permission only to display this image to its users. Additional permissions should be obtained from the applicable author or publisher of the image. Full text @ Cell Death Dis.