IMAGE

Fig. 3

ID
ZDB-IMAGE-240323-3
Source
Figures for Ma et al., 2024
Image
Figure Caption

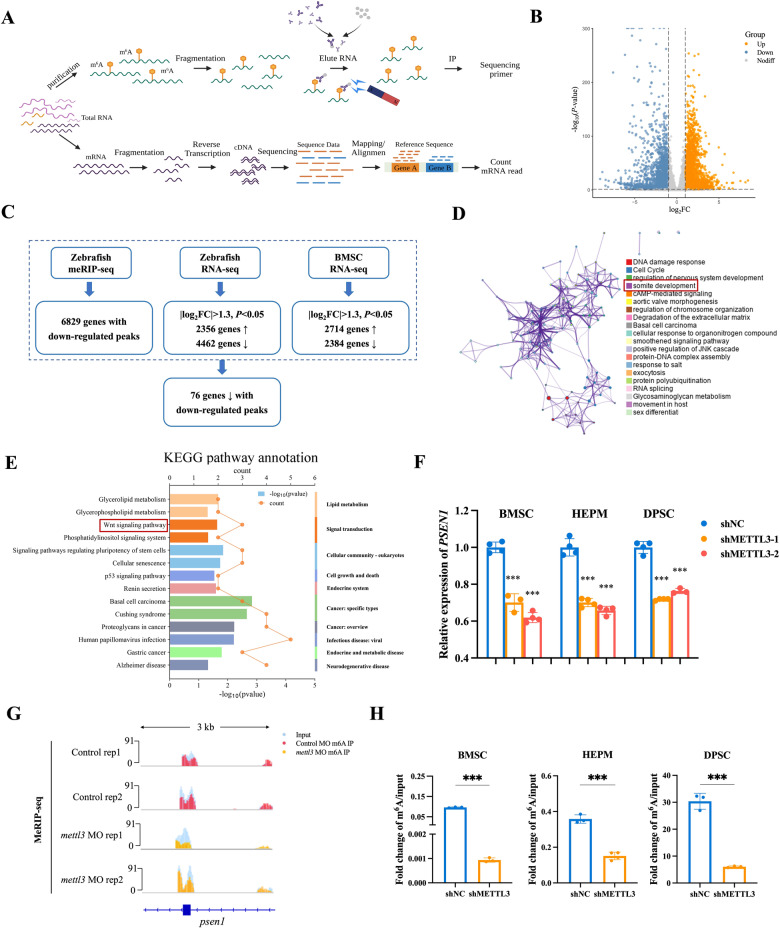
Fig. 3 Identification of METTL3 targets via MeRIP-seq and RNA-seq.

A Schematic diagram depicting the protocols used for MeRIP-seq and RNA-seq. B Volcano plot of differentially expressed genes between METTL3 knockdown and control BMSCs. C Flow chart showing the shared downregulated genes with hypomethylated m6A peaks. D Gene enrichment analysis performed via the Metascape database. E KEGG pathway enrichment analysis shows major signaling pathways in METTL3-knockdown BMSCs compared to control BMSCs. F The expression level of PSEN1 in BMSCs, HEPM cells, and DPSCs in the METTL3-knockdown and control groups. G The m6A abundances of psen1 transcript in mettl3-knockdown zebrafish embryos compared to control embryos. H Validation of m6A modification in METTL3-knockdown and control cells using MeRIP-qPCR. Results were presented as mean ± SD of three independent experiments. *P < 0.05, **P < 0.01 or ***P < 0.001 indicates a significant difference between the groups.

Acknowledgments
This image is the copyrighted work of the attributed author or publisher, and ZFIN has permission only to display this image to its users. Additional permissions should be obtained from the applicable author or publisher of the image. Full text @ Cell Death Dis.