IMAGE

Fig. 1

ID
ZDB-IMAGE-240323-1
Source
Figures for Ma et al., 2024
Image
Figure Caption

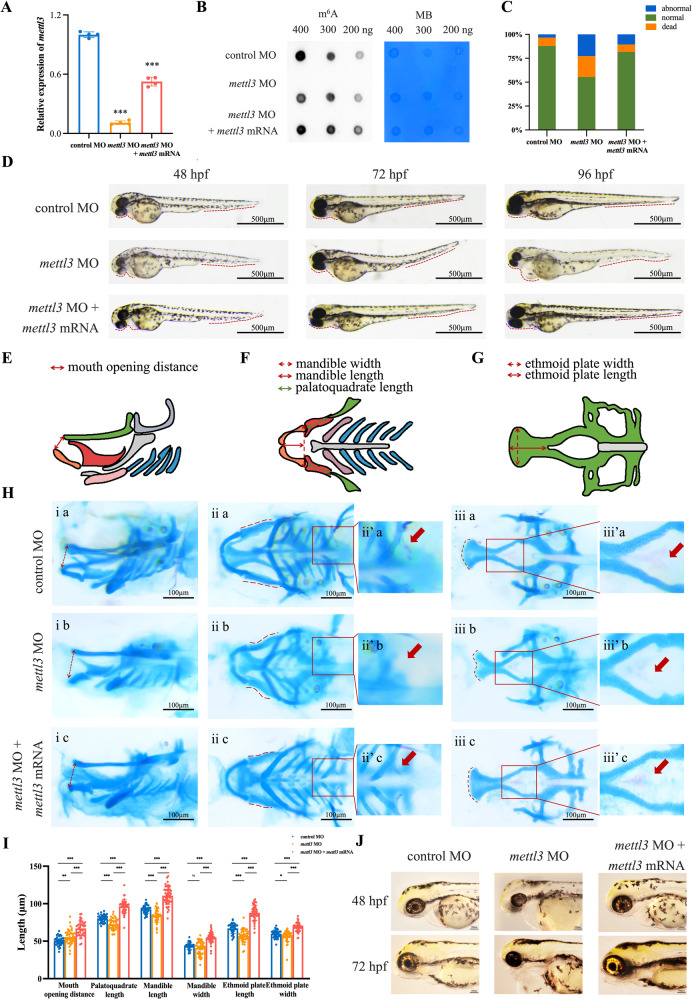
Fig. 1 Phenotypes of the zebrafish.

A The expression of mettl3 in zebrafish embryos injected with control morpholino (MO), mettl3 MO, or co-injection with mettl3 MO and mRNA at 48 hpf. B Representative dot blot showing m6A levels in zebrafish embryos injected with control MO, mettl3 MO, or co-injection with mettl3 MO and mRNA. MB, methylene blue staining. C Statistical analysis of the number of dead, abnormal or normal embryos. D Lateral view of zebrafish larvae injected with control MO, mettl3 MO, or co-injection with mettl3 MO and mRNA that were imaged with transmitted light at 48, 72, and 96 hpf. EG Schematic diagram of zebrafish craniofacial cartilage structures, including the distance of mouth opening, width and length of the mandible, length of the palatoquadrate, and width and length of the ethmoid plate, from lateral view and ventral views. H Zebrafish embryos at 144 hpf were stained with alcian blue and alizarin red to observe craniofacial structures. The red arrow shows the development of tooth and pharyngeal in zebrafish embryos. I Scatter histogram showing the length of the palatoquadrate, Meckel’s cartilage, and the ethmoid plate; the width of Meckel’s cartilage and the ethmoid plate; and the distance of mouth opening in zebrafish embryos injected with control MO, mettl3 MO, or co-injection with mettl3 MO and mRNA (each group, n = 100). J Iridophores at 48 and 72 hpf in zebrafish embryos injected with control MO, mettl3 MO, or co-injection with mettl3 MO and mRNA. Results were presented as mean ± SD of three independent experiments. *P < 0.05, **P < 0.01 or ***P < 0.001 indicates a significant difference between the groups.

Acknowledgments
This image is the copyrighted work of the attributed author or publisher, and ZFIN has permission only to display this image to its users. Additional permissions should be obtained from the applicable author or publisher of the image. Full text @ Cell Death Dis.