- Title
-
Removal of pomt1 in zebrafish leads to loss of α-dystroglycan glycosylation and dystroglycanopathy phenotypes
- Authors
- Karas, B.F., Terez, K.R., Mowla, S., Battula, N., Flannery, K.P., Gural, B.M., Aboussleman, G., Mubin, N., Manzini, M.C.
- Source
- Full text @ Hum. Mol. Genet.
|
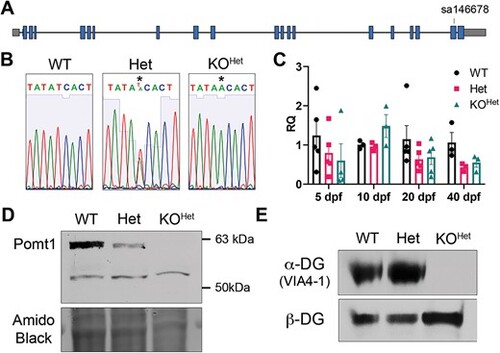
pomt1 nonsense variant leads to complete loss of protein and protein function. (A) Schematic of the gene structure of pomt1 including the location of the variant in exon 19. (B) Sanger sequencing validation shows the stop codon generated in the KO genome. (C) qPCR analysis showed consistent reduction in pomt1 mRNA apart from 10 dpf. All groups included 3?5 samples generated from composites of at least three animals. Although consistently trending within and over time points, data was not significantly different among genotypes. (D) Pomt1 is completely absent on Western blot in 30 dpf protein lysates from KOHet fish. (E) ?-DG glycosylation is absent in KOHet tissue while ?-DG expression is preserved. Alt-text. This figure shows confirmatory sequencing of the mutation in the fish line and RNA and protein analysis showing no change in mRNA expression, but loss of protein and alpha-dystroglycan glycosylation. EXPRESSION / LABELING:
PHENOTYPE:
|
|
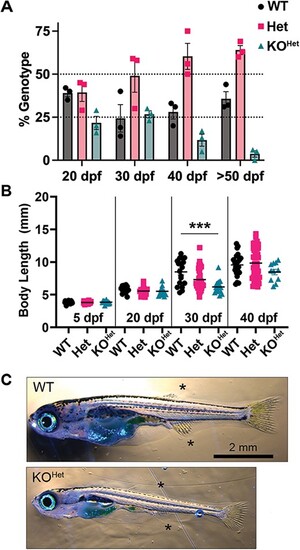
pomt1 KOHet fish show reduced survival and size. (A) Survival is indicated as deviation from expected Mendelian ratios (25% for WTs and KOHets, 50% for Hets) in 3 independent clutches showing a drop in pomt1 KOHet juveniles after 30 dpf. (B) Significant size differences are evident in KOHet fish at 30 dpf, but not in the surviving KOHet fish at 40 dpf. (C) pomt1 KOHet fish at 30 dpf appear underdeveloped with less prominent dorsal and anal fins (asterisks). Scale bar: 2 mm. ***p < 0.001. Alt-text. This figure shows that pomt1 knock-out fish lead to reduced survival and smaller size by 30 dpf. PHENOTYPE:
|
|
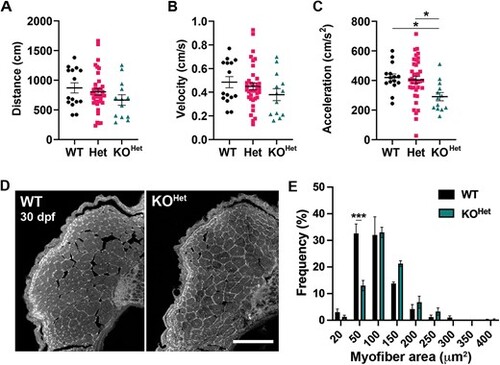
Muscle analysis in 30 dpf pomt1 KOHet juvenile zebrafish. (A?C) Automated tracking of motor activity showed only a trend for reduction in distance (A) and velocity (B), but significant reduction in acceleration (C) in KOHet animals compared to WT and Het. (D) Representative dorsal muscle axial cryosections stained with laminin that were used for muscle fiber area quantification. Scale bar: 100 ?m. (E) While overall muscle fiber area was not significantly different (Supplementary Fig. 2G), there was shift toward larger fibers in the KOHet where the frequency of fibers between 20 and 50 ?m2 was reduced. *p < 0.05. Alt-text. This figure shows that 30 dpf pomt1 knock-out fish obtained from heterozygous mothers only display reduced acceleration in locomotor assays and mild changes in muscle fiber size. PHENOTYPE:
|
|
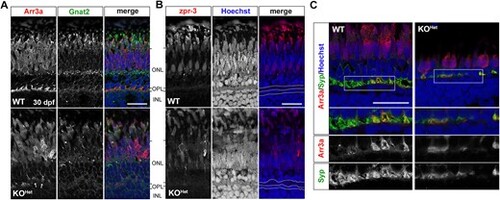
Photoreceptor synapses are disrupted in pomt1 KOHet retinae at 30 dpf. (A) Red/green double cone marker arrestin 3a (Arr3a) shows both disorganization in the outer segment and retraction of photoreceptors pedicles in the outer plexiform layer (OPL) (arrows). Cone-specific ?-transducin (Gnat2) staining is also reduced and lost in the outer limiting membrane. ONL: Outer nuclear layer; INL: Inner nuclear layer. Scale bar: 20 ?m B. Zpr-3 staining is reduced, but rods appear present in autofluorescence. Nuclear staining with Hoechst shows disorganization in the OPL and disruption in the nuclei of the horizontal cells below the OPL. OPL and horizontal cell nuclear layer are outlined by the white dotted lines. Scale bar: 20 ?m C. Synaptophysin (Syp) staining is discontinuous and showing loss of synaptic contacts. The white boxes outline the inset where immunostaining for each antibody is shown below. Scale bar: 20 ?m. Alt-text. This figure shows loss of photoreceptor synapses in pomt1 knock-out fish obtained from heterozygous mothers at 30 dpf. EXPRESSION / LABELING:
PHENOTYPE:
|
|
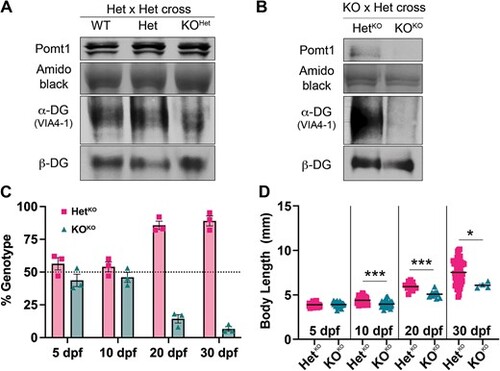
Removal of maternal pomt1 mRNA contribution from oocytes leads to earlier phenotypes in pomt1 KOKO larvae. (A) Residual Pomt1 is present in 5 dpf KOHet larvae derived from Het X Het crosses, as is ?-DG glycosylation. (B) Both Pomt1 and ?-DG glycosylation are absent at 5 dpf in KOKO larvae obtained from KO mothers crossed with Het fathers. (C) Survival in pomt1 KOKO zebrafish is reduced starting at 10 dpf as shown by the deviation from expected Mendelian ratios (50% for HetKOs and KOHets) in 3 independent clutches. (D). Reduced body size is observed in KOKO larvae and juveniles starting at 10 dpf. ***p < 0.001, *p < 0.05. Alt-text. This figure shows that pomt1 knock-out larvae from heterozygous mothers at 5 dpf still have Pomt1 present and that alpha-dystroglycan is glycosylated. When knock-out larvae are obtained from knock-out mothers both Pomt1 and alpha-dystroglycan glycosylation are absent. pomt1 knock-out larvae from knock-out mothers begin to die at 10 dpf and are significantly smaller than their clutch mates at the same age EXPRESSION / LABELING:
PHENOTYPE:
|
|
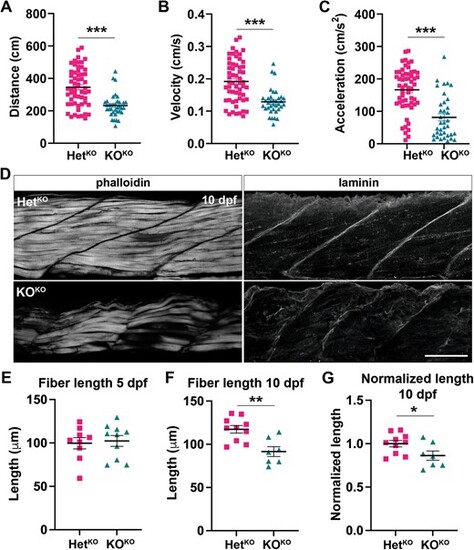
pomt1 KOKO larvae show reduced mobility at 5 dpf and muscle disease at 10 dpf. (A?C) A significant reduction in total distance traveled (A), velocity (B) and acceleration (C) are found in pomt1 KOKO larvae upon automated mobility analysis when compared to HetKO siblings. ***p < 0.001. (D) Staining with fluorescently labeled phalloidin to visualize actin in muscle fibers revealed fiber disorganization from in the 10 dpf KOKO larvae. Laminin staining was used to label the MTJ and showed discontinuities and disruption of the basement membrane between myomeres in KOKOs. See Supplementary Fig. 6A for 5 dpf muscle. Scale bar: 50 ?m. (E?G) Fiber length was the same at 5 dpf (E), but it was significantly reduced at 10 dpf (F) even when length was normalized for body length (G). **p < 0.01, *p < 0.05. Alt-text. This figure shows that pomt1 knock-out fish obtained from knock-out mothers have significant locomotor deficits at 5 dpf. In addition, the muscle is severely affected by 10 dpf where we find disorganization of muscle fibers, loss of laminin at the myotendinous junctions, and reduced muscle fiber length. |
|
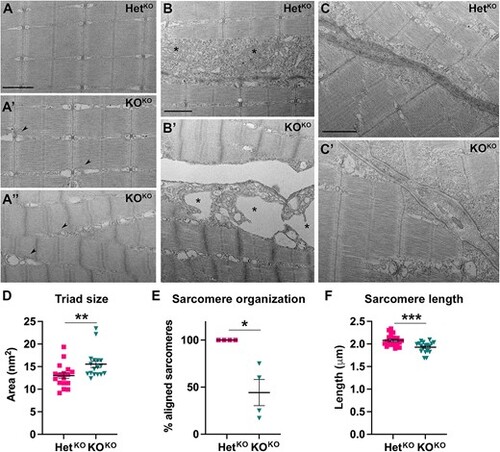
TEM analysis of pomt1 KOKO muscle at 10 dpf. (A) Sarcomeres showed variable severity of disruptions in KOKO larvae with enlargement of the SR (arrowheads in A? and A?) and misalignment of the sarcomeres in the most severely affected fish (A?). (B) The boundary between myofibers was detached in the KOKO (B?) with severe swelling and membrane disruption of the mitochondria. For comparison mitochondria are labeled with asterisks in both the HetKO (B) and KOKO (B?). (C) The MTJ showed reduced electron density and discontinuities in the border where myofibers are attached (white arrows in C?). Scale bars: 500 nm. (D) Quantification of triad area in independent muscle fibers from 4 larvae per genotypes showed a significant increase. See Supplementary Fig. 6C for quantification in moderately (A?) and severely (A?) affected fibers. (E) Quantification of the percentage of fibers with aligned (A?) or misaligned (A?) sarcomeres showed variability as expected for muscle disease, but all fish were affected. (F) Sarcomere length was significantly reduced in the pomt1 KOKO larvae. ***p < 0.001, **p < 0.01, *p < 0.05. Alt-text. This figure shows ultrastructural analysis using electron microscopy of 10 dpf pomt1 knock-out muscle. There is disorganization of the sarcomeres, enlargement of the sarcoplasmic reticulum, muscle fibers are separated from each other, and the myotendinous junctions show reduced intensity. PHENOTYPE:
|
|
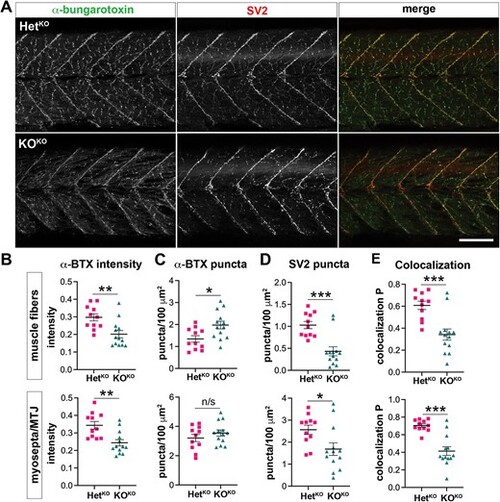
Neuromuscular junction (NMJ) analysis in 10 dpf pomt1 KOKO larvae. (A) Whole mount staining with ?-bungarotoxin (?-BTX, green) for acetylcholine receptors and SV2 for presynaptic sites showed both changes in intensity and organization in KOKO larvae. Scale bar: 100 ?m. (B) ?-BTX staining intensity was reduced both on muscle fibers in the myomeres and at the myosepta. (C) ?-BTX puncta number was increased on the muscle fibers. (D) SV2 puncta were reduced at both sites. (E) The Pearson coefficient of colocalization between the two markers was significantly reduced in both. ***p < 0.001, **p < 0.01, *p < 0.05. Alt-text. This figure shows analysis of the neuromuscular junction in 10 dpf pomt1 knock-out fish obtained from knock-out mothers using alpha-bungarotoxin and SV2 staining. There is reduced intensity of alpha bungarotoxin and a reduction of SV2 puncta |
|
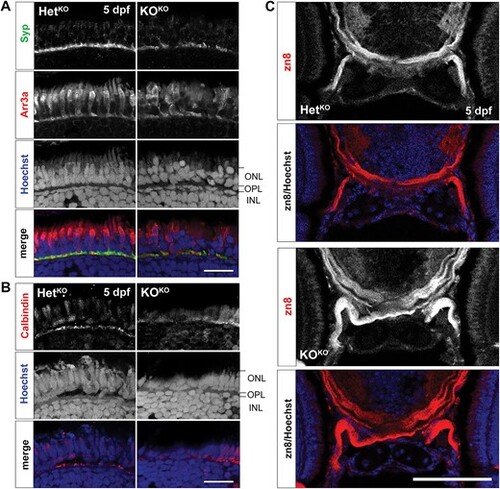
Retinal and axon guidance phenotypes are found at 5 dpf in pomt1 KOKO larvae. (A) Discontinuities in synaptophysin (Syp) staining are found in the outer plexiform layer (OPL) of pomt1 KOKO retinae. Red/green double cone marker arrestin 3a (Arr3a) again shows disorganized outer segments and patchy staining and altered shape of photoreceptors pedicles. Nuclear staining with Hoechst shows disorganization disruption in the photoreceptor nuclei in the outer nuclear layer (ONL) and in horizontal cell nuclei at the top of the inner nuclear layer (INL). Scale bar: 20 ?m. (B) Horizontal cell dendrites extending in the OPL are visualized using anti-calbindin staining and are disrupted in the KOKO retina. Scale bar: 20 ?m (C) The optic nerve was labeled using the zn8 antibody that marks retinal ganglion cell axons showing axon defasciculation after optic chiasm crossing. Imaged including the full head are shown in Supplementary Fig. 8B. Scale bar: 50 ?m. Alt-text. This figure shows that the same photoreceptor synapse loss phenotypes found at 30 dpf in Fig. 4 are already present at 5 dpf in pomt1 knock-out fish obtained from knock-out mothers. In addition, there is defasciculation of the optic tract indicating axon guidance deficits. |

ZFIN is incorporating published figure images and captions as part of an ongoing project. Figures from some publications have not yet been curated, or are not available for display because of copyright restrictions. |

