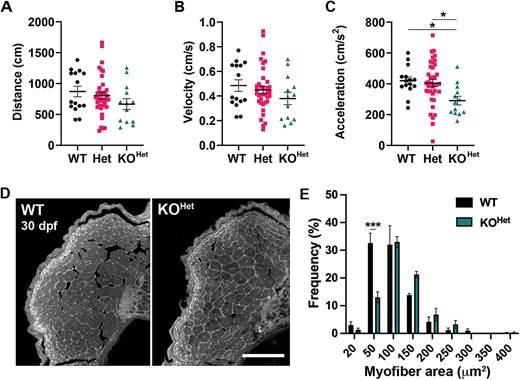
Fig. 3 Muscle analysis in 30 dpf pomt1 KOHet juvenile zebrafish. (A?C) Automated tracking of motor activity showed only a trend for reduction in distance (A) and velocity (B), but significant reduction in acceleration (C) in KOHet animals compared to WT and Het. (D) Representative dorsal muscle axial cryosections stained with laminin that were used for muscle fiber area quantification. Scale bar: 100 ?m. (E) While overall muscle fiber area was not significantly different (Supplementary Fig. 2G), there was shift toward larger fibers in the KOHet where the frequency of fibers between 20 and 50 ?m2 was reduced. *p < 0.05. Alt-text. This figure shows that 30 dpf pomt1 knock-out fish obtained from heterozygous mothers only display reduced acceleration in locomotor assays and mild changes in muscle fiber size.
Image
Figure Caption
Figure Data
Acknowledgments
This image is the copyrighted work of the attributed author or publisher, and
ZFIN has permission only to display this image to its users.
Additional permissions should be obtained from the applicable author or publisher of the image.
Full text @ Hum. Mol. Genet.

