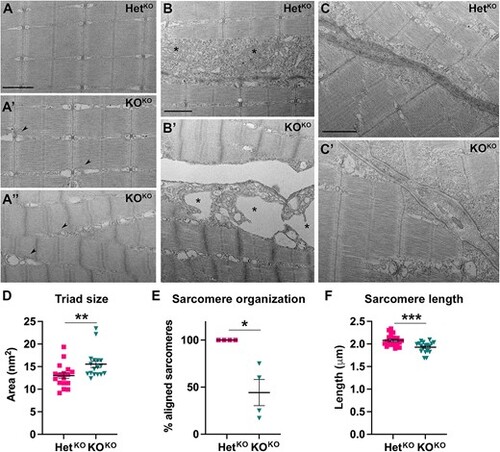
TEM analysis of pomt1 KOKO muscle at 10 dpf. (A) Sarcomeres showed variable severity of disruptions in KOKO larvae with enlargement of the SR (arrowheads in A′ and A″) and misalignment of the sarcomeres in the most severely affected fish (A″). (B) The boundary between myofibers was detached in the KOKO (B′) with severe swelling and membrane disruption of the mitochondria. For comparison mitochondria are labeled with asterisks in both the HetKO (B) and KOKO (B′). (C) The MTJ showed reduced electron density and discontinuities in the border where myofibers are attached (white arrows in C′). Scale bars: 500 nm. (D) Quantification of triad area in independent muscle fibers from 4 larvae per genotypes showed a significant increase. See Supplementary Fig. 6C for quantification in moderately (A′) and severely (A″) affected fibers. (E) Quantification of the percentage of fibers with aligned (A′) or misaligned (A″) sarcomeres showed variability as expected for muscle disease, but all fish were affected. (F) Sarcomere length was significantly reduced in the pomt1 KOKO larvae. ***p < 0.001, **p < 0.01, *p < 0.05. Alt-text. This figure shows ultrastructural analysis using electron microscopy of 10 dpf pomt1 knock-out muscle. There is disorganization of the sarcomeres, enlargement of the sarcoplasmic reticulum, muscle fibers are separated from each other, and the myotendinous junctions show reduced intensity.
|

