- Title
-
CLN3 deficiency leads to neurological and metabolic perturbations during early development
- Authors
- Heins-Marroquin, U., Singh, R.R., Perathoner, S., Gavotto, F., Merino Ruiz, C., Patraskaki, M., Gomez-Giro, G., Kleine Borgmann, F., Meyer, M., Carpentier, A., Warmoes, M.O., Jäger, C., Mittelbronn, M., Schwamborn, J.C., Cordero-Maldonado, M.L., Crawford, A.D., Schymanski, E.L., Linster, C.L.
- Source
- Full text @ Life Sci Alliance
|
Transient knockdown of |
|
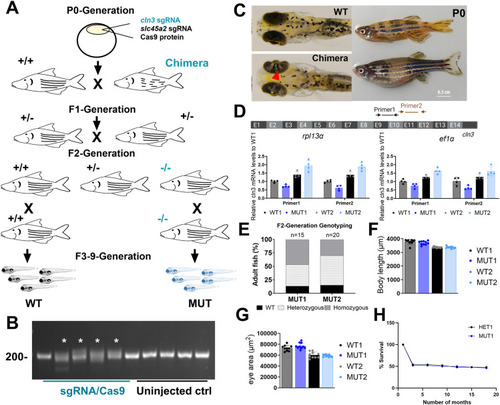
Generation of two stable |
|
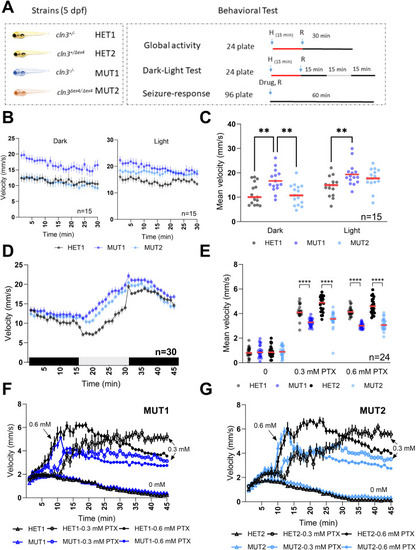
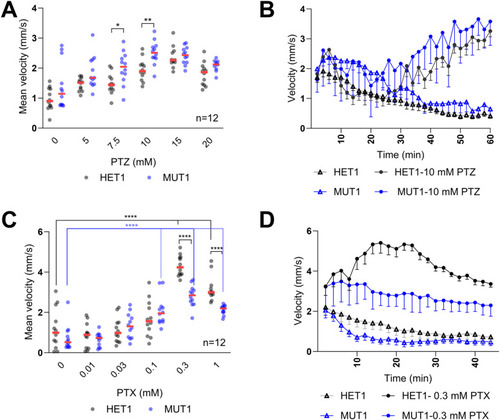
Locomotor behavior of |
|
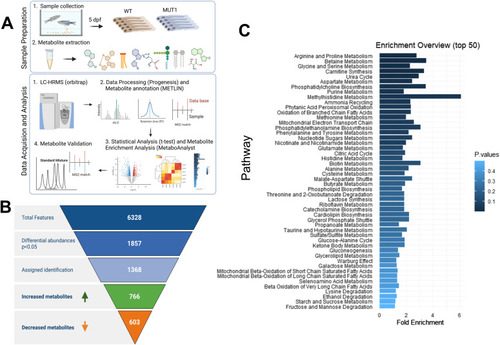
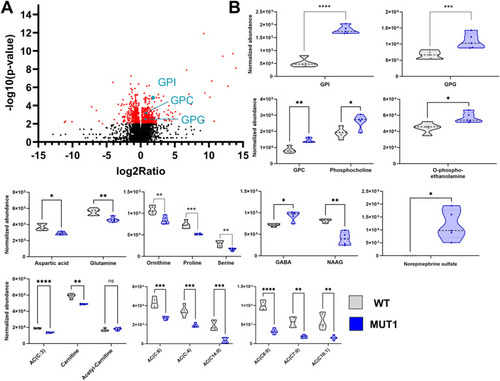
Untargeted metabolomics differentiates between WT and MUT1 samples. |
|
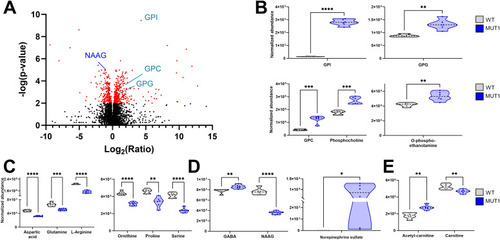
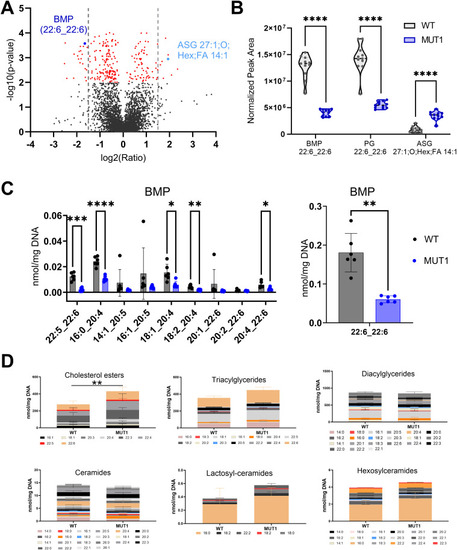
Most significantly altered metabolites between WT and MUT1 larvae based on untargeted metabolomics. |
|
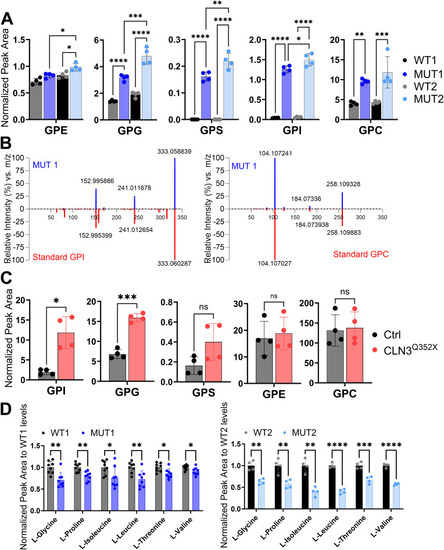
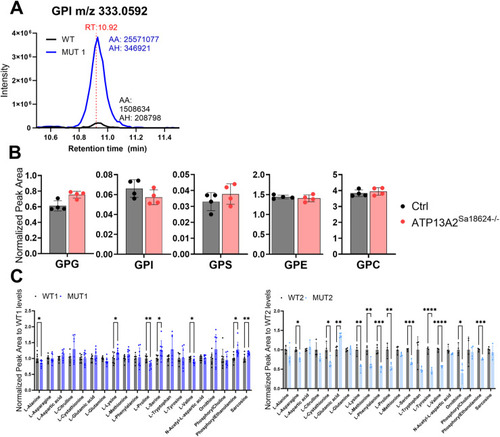
Validation of glycerophosphodiester and amino acid changes by targeted LC-MS analyses. |
|
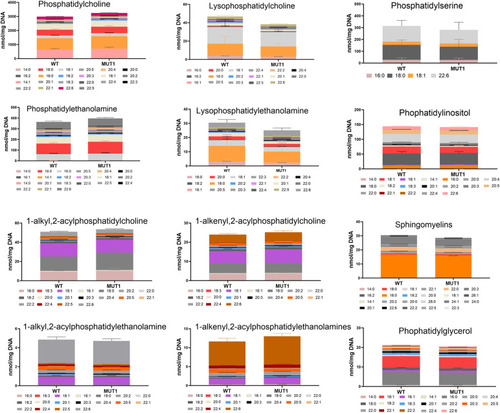
Lipidomics analysis in WT and MUT1 larvae. |
|
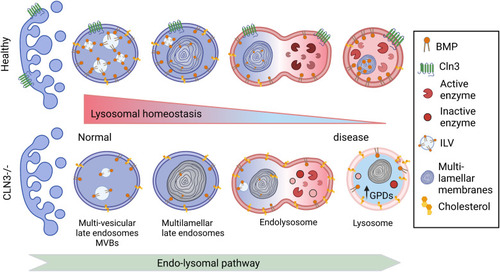
Proposed changes induced by CLN3 deficiency along the endolysosomal pathway In healthy cells, the number of intraluminal vesicles (ILVs) increases in the early endosomes to form multilamellar bodies in the late endosomes. The latter fuse with lysosomes forming a hybrid transient endolysosome to finally form secondary lysosomes. BMP is enriched in ILVs, and its levels increase during endosome maturation, contributing to ILV formation, ceramide degradation, and cholesterol efflux ( |
|
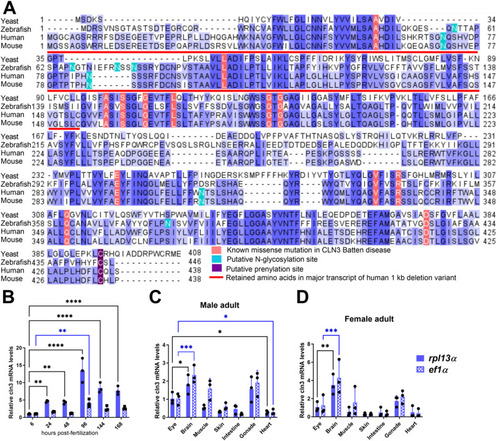
Conservation and expression of the zebrafish |
|
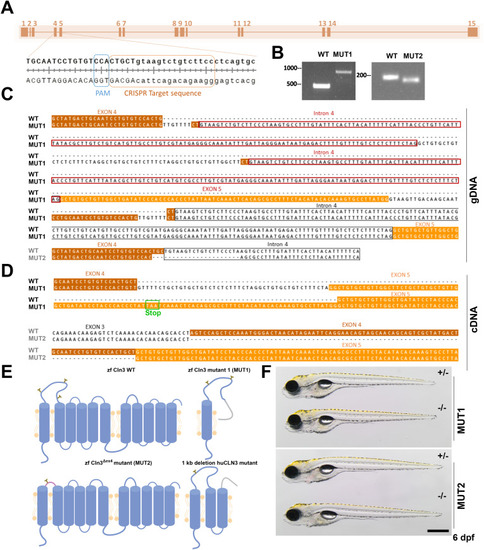
Generation of stable |
|
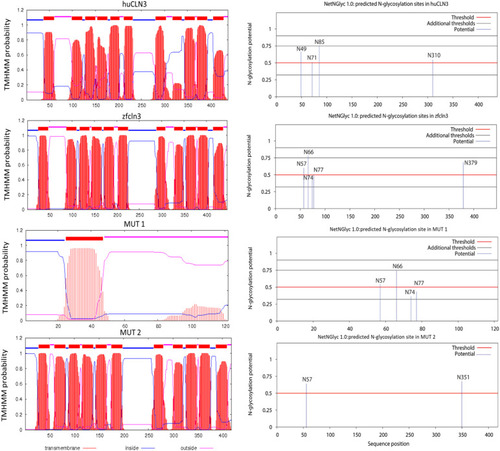
In silico prediction of transmembrane helices and N-glycosylation sites in huCLN3, zfcln3, and CRISPR mutants. The TMHMM (v2.0) program predicts 11 putative transmembrane (helical) regions in the wild-type human and zebrafish CLN3 proteins ( |
|
PTZ and PTX treatments in |
|
Untargeted metabolomics analysis using LC-MS (experiment 1). |
|
Multivariate and metabolite enrichment analyses of the untargeted metabolomics experiment 2. |
|
Most significantly altered metabolite classes between wild-type and MUT1 larvae (experiment 2). |
|
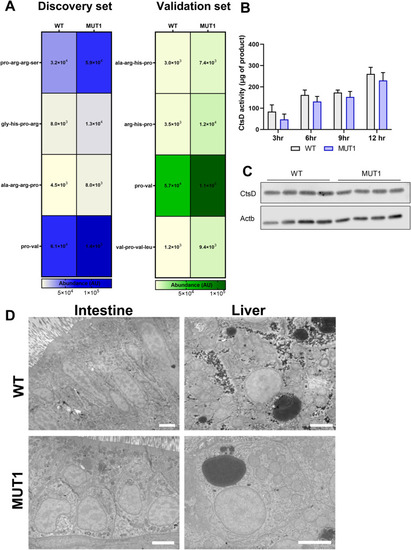
Indications for impaired proteolytic activity in MUT1 larvae. |
|
Analysis of GPDs and amino acids in polar extracts of WT, MUT1, and |
|
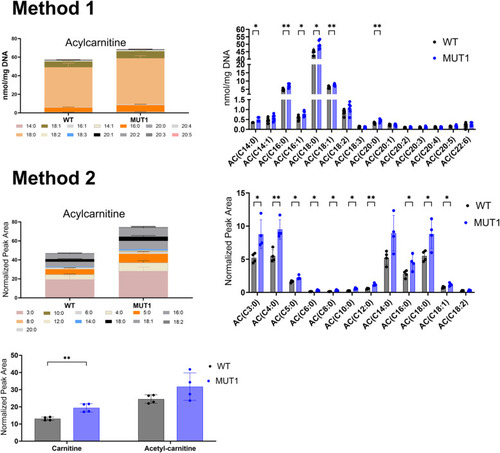
Acylcarnitine measurements using two independent targeted LC-MS methods. In the upper part, ACs were extracted and measured by Lipometrix (Method 1). In the lower part, carnitine, acetylcarnitine, and ACs were extracted and measured at the LCSB metabolomics facility (Method 2). Each dot represents a pool of 40 larvae, and in total, six (Method 1) and four (Method 2) biological replicates were measured. In both targeted methods, AC showed slightly increased levels in MUT1 compared with WT larvae. Statistically significant differences between the zebrafish lines were determined using an unpaired parametric multiple Welch’s |
|
Targeted analysis of phospholipids in MUT1 larvae. Stacked bar graphs of fatty acid composition for diverse phospholipid species assayed in non-polar extracts of 5 dpf zebrafish larvae using targeted LC-MS–based methods. Non-significant differences were observed between WT and MUT1 samples for these phospholipids. Each stacked bar is the average of six biological replicates of pools of 40 larvae, normalized against the DNA concentration. |


