IMAGE

Figure S1.

ID
ZDB-IMAGE-240111-21
Source
Figures for Heins-Marroquin et al., 2024
Image
Figure Caption

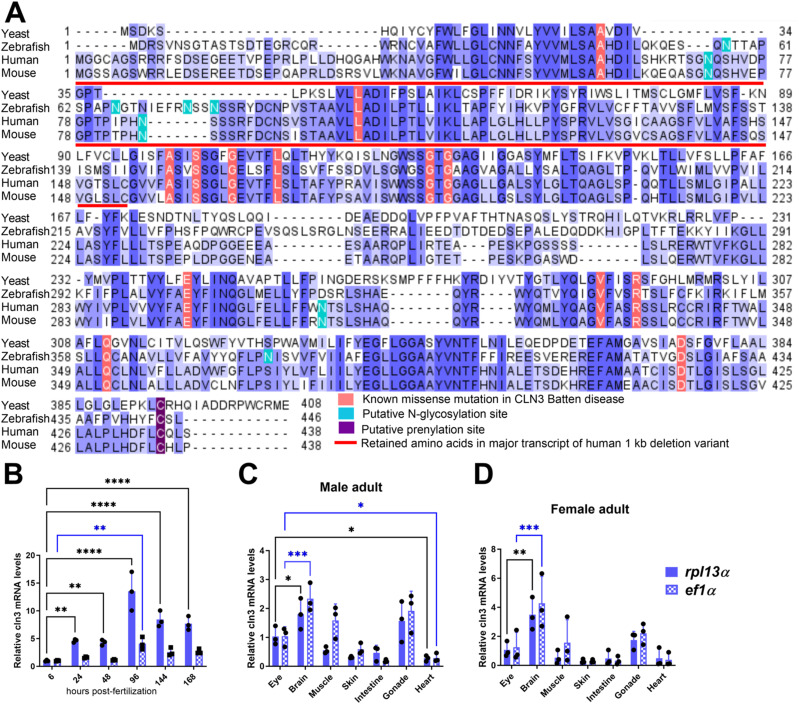
Figure S1. Conservation and expression of the zebrafish cln3 gene.

(A) Multiple sequence alignment of CLN3 protein sequences shows high conservation across various species (yeast, Saccharomyces cerevisiae sequence NP_012476.1; zebrafish, Danio rerio sequence NP_001007307; human, Homo sapiens sequence NP_001273038; and mouse, Mus musculus sequence NP_001139783). Gaps are indicated with dashes, and different shades of blue were used to represent the conservation level: dark blue, blue, and light blue for 100%, 75%, and 50% conservation in the selected sequences, respectively. Residues in the human sequence known to harbor missense mutations in CLN3 Batten disease are highlighted in red. The red line indicates the 153 amino acids preserved from the wild-type protein in the major transcript expressed from the 1-kb deletion allele of human CLN3. Post-translational modification sites are highlighted in green and violet. The main experimentally validated post-translational modifications are indicated (25, 26, 70). For the zebrafish Cln3 sequence, residues 1–122 may be preserved in a putative truncated expression product in the MUT1 line and residues 62–90 are missing in the predicted variant expressed by the MUT2 line described in this study. (B) Zebrafish cln3 expression levels at different developmental stages are represented relative to the expression level at 6 hpf. (C, D) Zebrafish cln3 expression levels in the indicated organs are shown relative to the expression levels in the eye. RNA was extracted from the organs of 2-yr-old male and female zebrafish for qPCR analysis. All expression levels were normalized to either the rpl13α (dark blue) or the ef1α (dotted light blue) reference genes, which were reported to be stably expressed during development and across tissues (71, 72). Data shown in panel B are technical replicates of a pool of 30 larvae. (B, C, D) Data shown are means ± SDs from three technical replicates of a pool of 30 larvae (B) or from biological replicates of three adult fish (C, D). Statistical significance was estimated using the two-way ANOVA test (*P ≤ 0.05; **P ≤ 0.01; ***P ≤ 0.001; and ****P < 0.0001). hpf, hours post-fertilization.

Acknowledgments
This image is the copyrighted work of the attributed author or publisher, and ZFIN has permission only to display this image to its users. Additional permissions should be obtained from the applicable author or publisher of the image. Full text @ Life Sci Alliance