|
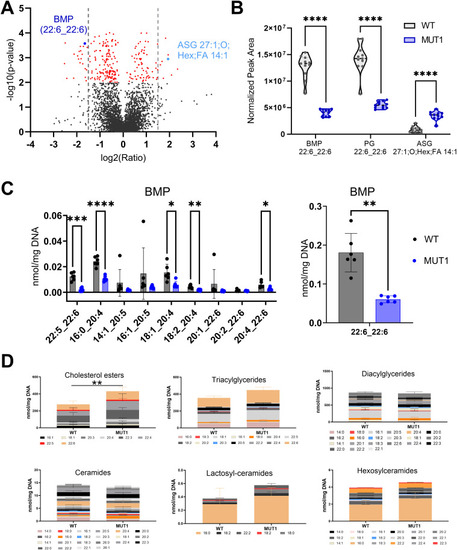
Lipidomics analysis in WT and MUT1 larvae. (A) Volcano plot with annotated lipids found by untargeted lipidomics in non-polar extracts derived from the zebrafish larva samples generated in both experimental sets as described in the main text. Each dot represents a metabolite, and lipids with a significantly different abundance value in WT and MUT1 extracts are shown in red (P < 0.001). Gray dotted lines indicate the 1.5-fold change log2 ratio cutoff. BMP (44:12) and ASG (27:1; O;Hex;FA 14:1) are highlighted in dark and light blue, respectively. (B) Violin plots for the most significantly altered lipids based on untargeted lipidomics analysis. (C) Targeted BMP analysis in zebrafish extracts at 5 dpf. Data shown are means ± SDs for six biological replicates. Statistically significant differences between WT (gray) and MUT1 (blue) were determined using an unpaired multiple Welch’s t test (*P ≤ 0.05; **P ≤ 0.01; ***P ≤ 0.001; and ****P ≤ 0.0001). (D) Stacked bar graphs for the indicated lipid classes measured by targeted lipidomics in 5 dpf zebrafish larvae. Each stacked bar is the sum of the average amounts measured for the indicated lipid species in six biological replicates of a pool of 40 larvae, normalized against its DNA concentration. Error bars represent SDs. Statistically significant differences between both zebrafish lines were determined using a two-way ANOVA test on the summed averages for each lipid class (**P ≤ 0.01) (n = 240 larvae for each genotype).
|

