Image
Figure Caption
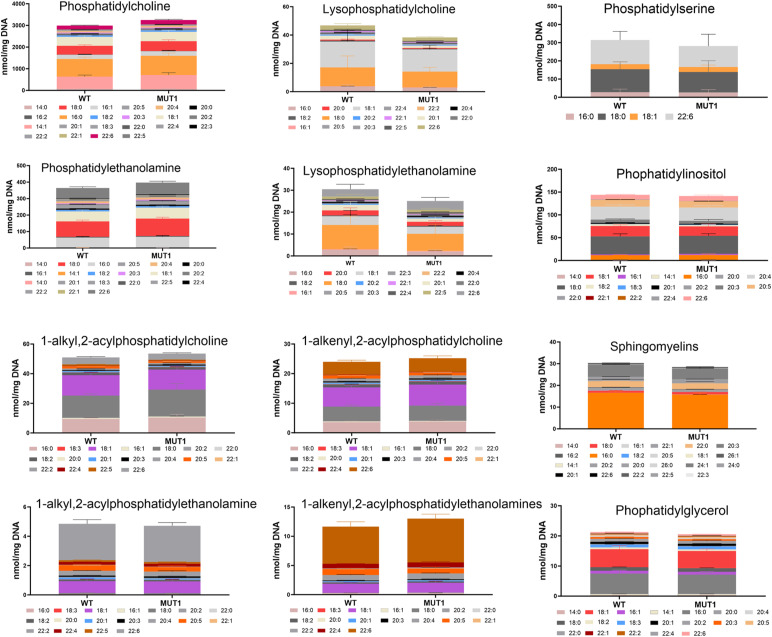
Figure S11. Targeted analysis of phospholipids in MUT1 larvae.
Stacked bar graphs of fatty acid composition for diverse phospholipid species assayed in non-polar extracts of 5 dpf zebrafish larvae using targeted LC-MS–based methods. Non-significant differences were observed between WT and MUT1 samples for these phospholipids. Each stacked bar is the average of six biological replicates of pools of 40 larvae, normalized against the DNA concentration.
Acknowledgments
This image is the copyrighted work of the attributed author or publisher, and
ZFIN has permission only to display this image to its users.
Additional permissions should be obtained from the applicable author or publisher of the image.
Full text @ Life Sci Alliance

