- Title
-
RNF213 loss-of-function promotes pathological angiogenesis in moyamoya disease via the Hippo pathway
- Authors
- Ye, F., Niu, X., Liang, F., Dai, Y., Liang, J., Li, J., Wu, X., Zheng, H., Qi, T., Sheng, W.
- Source
- Full text @ Brain
|
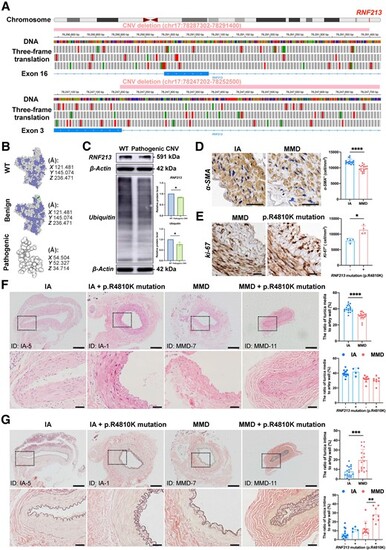
RNF213 loss-of-function mutations exist in some MMD patients and are positively associated with intimal hyperplasia in MMD patients. (A) The integrative genomics viewer (IGV) application showed a benign copy number variant (CNV) deletion (chr17:78287302-78291400) that completely damages the genomic sequence of exon 16 and a likely pathogenic CNV deletion (chr17:78247202-78252500) that partly damages the genomic sequence of exon 3 in RNF213. The green boxes indicate a start codon, while the red boxes indicate termination codons in the three-frame translation. (B) The protein structure of the wild-type (WT) RNF213 protein (Q63HN8) was modelled with 100.0% confidence based on the single highest-scoring template of the well-known mouse Rnf213 (c7oikA). The benign CNV deletion of RNF213 showed a high identity (99.42%) with WT, while the clinically relevant CNV deletion of RNF213 showed a very low similarity (30.48%) with WT, and only 69 residues were modelled with 43.4% confidence using SWISS-Model and Phyre2. (C) Quantitative analysis of RNF213 and ubiquitin protein levels in one intracranial aneurysm (IA) patient and moyamoya disease (MMD) patient carrying the pathogenic RNF213 mutation of exon 3 (RNF213, n = 4, 1.00 ▒ 0.00 versus 0.84 ▒ 0.03, P = 0.0286; ubiquitin, n = 4, 1.00 ▒ 0.00 versus 0.78 ▒ 0.09, P = 0.0286). (D) The vascular smooth muscles were then stained with an ?-SMA antibody, and the region of interest (ROI)-based quantitative analysis of ?-SMA+ cells in the tunica media indicated a relative loss of smooth muscle in MMD patients (n = 18, 11944.81 ▒ 783.90 versus 9796.53 ▒ 962.64 cell/mm2, P < 0.0001). Scale bar = 20 Ám. (E) The density of Ki-67 was quantitatively analysed in the tunica intima, which indicated the presence of increased number of Ki-67+ cells in MMD patients with RNF213 mutation (n = 4, 7944.90 ▒ 706.61 versus 11 373.69 ▒ 1348.96 cell/mm2, P = 0.0286). Scale bar = 20 Ám. (F) Haematoxylin and eosin staining was used for morphometric analysis of the vascular wall structure of donor superficial temporal artery (STA) sections from MMD and IA patients. MMD patients showed a significantly thinner tunica media than IA patients (n = 18, 31.09 ▒ 4.35 versus 40.22 ▒ 4.33%, P < 0.0001). No significant difference in tunica media thickness was observed between MMD patients with RNF213 mutation and those without RNF213 mutation (n = 8 versus 10, 30.19 ▒ 4.86 versus 31.82 ▒ 4.01%, P = 0.3599). A significant difference in tunica media thickness was not observed between IA patients carrying RNF213 mutation and those without RNF213 mutation (n = 4 versus 14, 42.00 ▒ 5.27 versus 39.71 ▒ 4.11%, P = 0.4418). Scale bar = 200 Ám (top); scale bar = 40 Ám (bottom). (G) Weigert?s resorcin-fuchsin staining was applied for morphometric analysis of the internal elastic membranes in MMD and IA patients. MMD patients showed significantly thicker internal elastic membranes than IA patients (n = 18, 19.53 ▒ 11.16 versus 7.68 ▒ 5.12%, P = 0.0007). MMD patients carrying RNF213 mutation presented with a significantly greater tunica intima thickness than MMD patients without RNF213 mutation (n = 8 versus 10, 28.29 ▒ 7.87 versus 12.53 ▒ 8.02%, P = 0.0014). No significant difference in tunica intima thickness was observed between IA patients with RNF213 mutation and those without RNF213 mutation (n = 4 versus 14, 11.55 ▒ 2.54 versus 6.58 ▒ 5.18%, P = 0.0791). Scale bar = 200 Ám (top); scale bar = 40 Ám (bottom). Each dot represents one sample. The means ▒ SDs are shown. The dashed line indicates the ROI. *P < 0.05, **P < 0.01, ***P < 0.001 and ****P < 0.0001. |
|
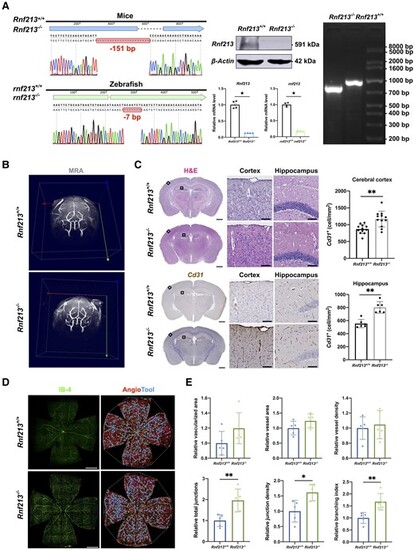
RNF213 deletion promotes pathological angiogenesis in vivo. (A) Sanger sequencing revealed a 151-bp deletion in mice and a 7-bp deletion in zebrafish. Western blots of mouse brain tissues validated an ?90% decrease in Rnf213 expression in Rnf213?/? mice (n = 4, 1.00 ▒ 0.00 versus 0.07 ▒ 0.02, P = 0.0286). Quantitative RT-PCR confirmed the significantly reduced gene expression levels (Rnf213, n = 4, 1.00 ▒ 0.11 versus 0.13 ▒ 0.01, P = 0.0286; rnf213, n = 4, 0.99 ▒ 0.06 versus 0.17 ▒ 0.02, P = 0.0286). Agarose gel electrophoresis further confirmed this homozygous mutation in mice. (B) No significant differences in steno-occlusive arteries in the major branches of the Willis circle were observed between Rnf213+/+ and Rnf213?/? mice using 7.0 T magnetic resonance angiography. (C) The complete structure of the cerebral vessels was stained with haematoxylin and eosin (H&E) and subjected to immunohistochemistry. From each section, one similar region of the hippocampus and three similar cortical regions in the unilateral cerebral hemisphere were randomly selected. The Rnf213?/? mice showed a significantly increased vessel density in both the cerebral cortex (n = 12, 868.77 ▒ 133.61 versus 1167.60 ▒ 234.25 cell/mm2, P = 0.0011) and hippocampus (n = 6, 554.19 ▒ 63.98 versus 802.66 ▒ 88.41 cell/mm2, P = 0.0022). Scale bar = 1 mm (left); scale bar = 100 Ám (right). (D) Vessels throughout the retinas from Rnf213+/+ and Rnf213?/? mice were labelled with IB-4. AngioTool software was used to automatically detect the vessel length (red) and junctions (blue). Scale bar = 500 Ám. (E) No significant differences in the relative vascularized area (n = 5, 1.00 ▒ 0.16 versus 1.20 ▒ 0.21, P = 0.0952), vessel area (n = 5, 1.00 ▒ 0.23 versus 1.24 ▒ 0.23, P = 0.2222), and vessel density (n = 5, 1.00 ▒ 0.15 versus 1.05 ▒ 0.19, P > 0.9999) were observed between Rnf213+/+ and Rnf213?/? mice. Compared to Rnf213+/+ mice, Rnf213?/? mice showed significantly increased total junction numbers (n = 5, 1.00 ▒ 0.29 versus 1.96 ▒ 0.54, P = 0.0079), junction density (n = 5, 1.00 ▒ 0.35 versus 1.62 ▒ 0.27, P = 0.0159), and branch numbers (n = 5, 1.00 ▒ 0.25 versus 1.67 ▒ 0.34, P = 0.0079). Each dot represents one sample. The means ▒ SDs are shown. The dashed line indicates the region of interest. *P < 0.05, **P < 0.01, ***P < 0.001 and ****P < 0.0001. |
|
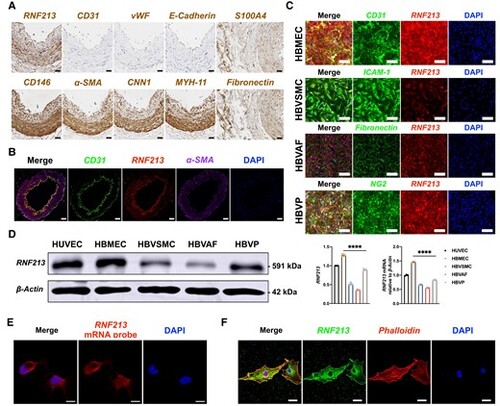
Human brain microvascular endothelial cells (HBMECs) are the major sources of RNF213. (A) Immunohistochemistry staining of donor superficial temporal artery sections from patients with intracranial aneurysm (IA). The RNF213 protein was expressed in all of the vascular walls. Endothelial markers [CD31, von Willebrand factor (vWF) and E-cadherin] were obviously located inside the vascular wall. Smooth muscle markers [?-SMA,calponin-1 (CNN1), smooth muscle myosin heavy chain 11 (MYH-11)] and pericyte markers (CD146 and ?-SMA) were expressed mainly in the tunica media. Fibroblast markers (fibronectin and S100A4) were expressed mainly in the tunica adventitia. Scale bar = 20 Ám. (B) The RNF213 protein co-localized with CD31 in the vascular wall. Scale bar = 50 Ám. (C) The RNF213 protein was expressed at higher levels in human brain microvascular endothelial cells (HBMECs) and human brain vascular pericytes (HBVPs) than in human brain vascular adventitial fibroblasts (HBVAFs) or human brain vascular smooth muscle cells (HBVSMCs). Scale bar = 100 Ám. (D) Using human umbilical vein endothelial cells (HUVECs) as controls, western blots revealed significantly higher RNF213 protein expression levels in HBMECs than in other cells (n = 4, 1.28 ▒ 0.03 versus 0.52 ▒ 0.03 versus 0.36 ▒ 0.01 versus 0.89 ▒ 0.02, P < 0.0001, Kruskal?Wallis statistic =14.12), which was confirmed by performing a qRT-PCR analysis (n = 3, 1.47 ▒ 0.03 versus 0.67 ▒ 0.02 versus 0.56 ▒ 0.02 versus 0.84 ▒ 0.02, P < 0.0001, Kruskal?Wallis statistic =10.38). (E) RNF213 is mainly expressed in the cytoplasm of HBMECs, as shown by fluorescent in situ hybridization. Scale bar = 10 Ám. (F) Confocal microscopy revealed stronger RNF213 protein expression in the cytoplasm than in the nucleus. Scale bar = 20 Ám. Each dot represents one sample. The means ▒ SDs are shown. The dashed line indicates the region of interest. *P < 0.05, **P < 0.01, ***P < 0.001 and ****P < 0.0001. |
|
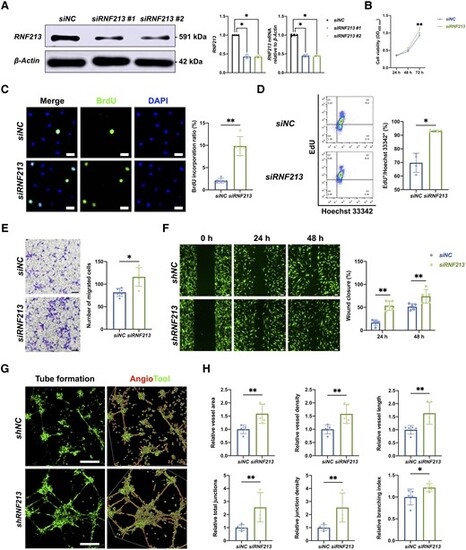
Endothelial RNF213 knockdown promotes HBMEC proliferation, migration and angiogenesis. (A) Two designed siRNA/shRNA sequences were used to mimic RNF213 loss-of-function conditions, which were confirmed by western blot (siNC versus siRNF213 #1: n = 4, 1.00 ▒ 0.00 versus 0.43 ▒ 0.05, P = 0.0286; siNC versus siRNF213 #2: n = 4, 1.00 ▒ 0.00 versus 0.42 ▒ 0.03, P = 0.0286) and qRT-PCR analyses (siNC versus siRNF213 #1: n = 4, 1.00 ▒ 0.03 versus 0.45 ▒ 0.04, P = 0.0286; siNC versus siRNF213 #2: n = 4, 1.00 ▒ 0.03 versus 0.45 ▒ 0.02, P = 0.0286). (B) The siRNF213-treated human brain microvascular endothelial cells (HBMECs) showed greater cell viability than the siNC-treated HBMECs at 48 h (n = 6, 0.47 ▒ 0.03 versus 0.52 ▒ 0.05, P = 0.0931) and also showed significantly greater cell viability at 72 h (n = 6, 0.93 ▒ 0.07 versus 1.09 ▒ 0.06, P = 0.004) based on the results of CCK-8 assays. (C) A BrdU incorporation assay was conducted to measure the proliferation of siNC- and siRNF213-treated HBMECs. The siRNF213-treated HBMECs showed a significantly greater BrdU incorporation ratio than the siNC-treated HBMECs (n = 5, 2.09 ▒ 0.47 versus 9.84 ▒ 1.89%, P = 0.0079). Scale bar = 20 Ám. (D) Flow cytometry was used to assess the proliferation of siNC- and siRNF213-treated HBMECs after labelling with EdU and Hoechst 33342. The siRNF213-treated HBMECs showed a significantly greater cell proliferation ratio than the siNC-treated HBMECs (n = 4, 69.75 ▒ 6.07 versus 93.15 ▒ 0.62%, P = 0.0286). (E) Transwell assays were performed to measure vertical HBMEC migration. siRNF213-treated HBMECs showed greater vertical migration than siNC-treated HBMECs (n = 6, 86.25 ▒ 38.92 versus 124.75 ▒ 57.69, P = 0.0152). Scale bar = 100 Ám. (F) A wound healing assay was used to measure horizontal HBMEC migration. The siRNF213-treated HBMECs showed markedly greater horizontal migration than the siNC-treated HBMECs at 24 h (n = 5, 16.16 ▒ 6.44 versus 55.45 ▒ 9.20, P = 0.0079) and 48 h (n = 5, 49.76 ▒ 5.26 versus 73.36 ▒ 14.78, P = 0.0079). Scale bar = 100 Ám. (G) A tube formation assay was performed to measure HBMEC angiogenesis. AngioTool software was used to automatically detect the vessel length (red) and junctions (green). Scale bar = 100 Ám. (H) The siRNF213-treated HBMECs showed significantly greater vessel area (n = 5, 1.00 ▒ 0.16 versus 1.59 ▒ 0.36, P = 0.0079), vessel density (n = 5, 1.00 ▒ 0.17 versus 1.58 ▒ 0.36, P = 0.0079), vessel length (n = 5, 1.00 ▒ 0.16 versus 1.63 ▒ 0.42, P = 0.0079), total number of junctions (n = 5, 1.00 ▒ 0.22 versus 2.56 ▒ 1.13, P = 0.0079), junction density (n = 5, 1.00 ▒ 0.23 versus 2.54 ▒ 1.12, P = 0.0079), and branching index values (n = 5, 1.00 ▒ 0.18 versus 1.22 ▒ 0.09, P = 0.0317) than the siNC-treated HBMECs. Each dot represents one sample. The means ▒ SDs are shown. The dashed line indicates the region of interest. *P < 0.05, **P < 0.01, ***P < 0.001 and ****P < 0.0001. |
|
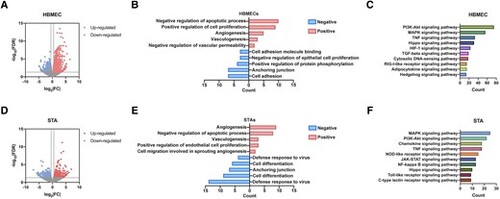
The Hippo signalling pathway might be involved in RNF213-related MMD pathogenesis, as shown through bioinformatics analyses. (A) Volcano plot showing 2633 differentially expressed genes (DEGs) between siNC- and siRNF213-treated human brain microvascular endothelial cell (HBMECs), including 1431 upregulated (red) and 1202 downregulated (blue) DEGs. (B) GO analysis indicated functions that were positively and negatively regulated by the top 100 RNF213-related DEGs. (C) Functional enrichment analysis of pathways significantly enriched in the RNF213-related DEGs. (D) Volcano plot showing 584 DEGs between intracranial aneurysm (IA) donor superficial temporal arteries and moyamoya disease (MMD) donor superficial temporal arteries, including 301 upregulated (red) and 283 downregulated (blue) DEGs. (E) GO analysis of functions that were positively and negatively regulated by the top 100 MMD-related DEGs. (F) Functional enrichment analysis of pathways significantly enriched in MMD-related DEGs. |
|
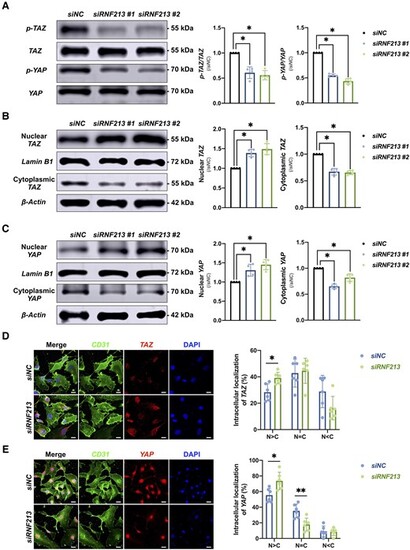
Endothelial RNF213 knockdown activates the Hippo effectors TAZ and YAP. (A) Quantitative analysis of p-TAZ/TAZ and p-YAP/YAP protein levels in siNC- and siRNF213-treated HBMECs (p-TAZ/TAZ, n = 4, siNC versus siRNF213 #1 = 1.00 ▒ 0.00 versus 0.61 ▒ 0.12, P = 0.0286; siNC versus siRNF213 #2 = 1.00 ▒ 0.00 versus 0.56 ▒ 0.09, P = 0.0286; p-YAP/YAP, n = 4, siNC versus siRNF213 #1 = 1.00 ▒ 0.00 versus 0.55 ▒ 0.03, P = 0.0286; siNC versus siRNF213 #2 = 1.00 ▒ 0.00 versus 0.43 ▒ 0.05, P = 0.0286). (B) Quantitative analysis of nuclear (N) and cytoplasmic (C) TAZ protein levels in siNC- and siRNF213-treated HBMECs at the nuclear and cytoplasmic levels (nuclear TAZ, n = 4, siNC versus siRNF213 #1 = 1.00 ▒ 0.00 versus 1.39 ▒ 0.09, P = 0.0286; siNC versus siRNF213 #2 = 1.00 ▒ 0.00 versus 1.49 ▒ 0.14, P = 0.0286; cytoplasmic TAZ, n = 4, siNC versus siRNF213 #1 = 1.00 ▒ 0.00 versus 0.67 ▒ 0.06, P = 0.0286; siNC versus siRNF213 #2 = 1.00 ▒ 0.00 versus 0.66 ▒ 0.04, P = 0.0286). (C) Quantitative analysis of nuclear and cytoplasmic YAP protein levels in siNC- and siRNF213-treated HBMECs at the nuclear and cytoplasmic levels (nuclear YAP, n = 4, siNC versus siRNF213 #1 = 1.00 ▒ 0.00 versus 1.31 ▒ 0.16, P = 0.0286; siNC versus siRNF213 #2 = 1.00 ▒ 0.00 versus 1.45 ▒ 0.13, P = 0.0286; cytoplasmic YAP, n = 4, siNC versus siRNF213 #1 = 1.00 ▒ 0.00 versus 0.65 ▒ 0.04, P = 0.0286; siNC versus siRNF213 #2 = 1.00 ▒ 0.00 versus 0.82 ▒ 0.07, P = 0.0286). (D) Analysis of the difference in the distribution of TAZ protein expression between siNC- and siRNF213-treated HBMECs (N > C, n = 6, 28.30 ▒ 6.42 versus 39.16 ▒ 4.33%, P = 0.0152; N = C, n = 6, 42.83 ▒ 10.61 versus 44.55 ▒ 9.51%, P > 0.9999; N < C, n = 6, 28.87 ▒ 12.25 versus 16.29 ▒ 8.89%, P = 0.0931). Scale bar = 20 Ám. (E) Analysis of the difference in the distribution of YAP protein expression between siNC- and siRNF213-treated HBMECs (N > C, n = 6, 55.42 ▒ 8.72 versus 73.75 ▒ 11.09%, P = 0.0152; N = C, n = 6, 35.34 ▒ 8.67 versus 17.87 ▒ 8.22%, P = 0.0087; N < C, n = 6, 9.25 ▒ 6.78 versus 8.39 ▒ 4.71%, P = 0.7879). Scale bar = 20 Ám. Each dot represents one sample. The means ▒ SDs are shown. The dashed line indicates the region of interest. *P < 0.05, **P < 0.01, ***P < 0.001, ****P < 0.0001. |
|
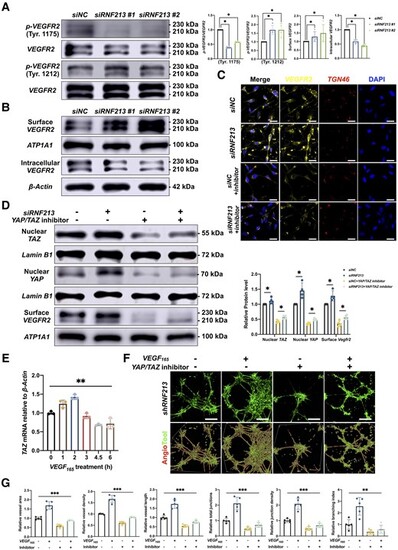
Inhibition of YAP/TAZ expression reverses RNF213-induced angiogenesis. (A) Quantitative analysis of the p-VEGFR2/VEGFR2 protein ratio in siNC- and siRNF213-treated HBMECs (Tyr.1175, n = 4, siNC versus siRNF213 #1 = 1.00 ▒ 0.00 versus 0.39 ▒ 0.03, P = 0.0286; siNC versus siRNF213 #2 = 1.00 ▒ 0.00 versus 0.57 ▒ 0.02, P = 0.0286; Tyr.1212, n = 4, siNC versus siRNF213 #1 = 1.00 ▒ 0.00 versus 1.69 ▒ 0.26, P = 0.0286; siNC versus siRNF213 #2 = 1.00 ▒ 0.00 versus 1.70 ▒ 0.37, P = 0.0286). (B) Quantitative analysis of surface and intracellular VEGFR2 protein levels between siNC- and siRNF213-treated HBMECs (surface VEGFR2, n = 4, siNC versus siRNF213 #1 = 1.00 ▒ 0.00 versus 1.28 ▒ 0.29, P = 0.0286; siNC versus siRNF213 #2 = 1.00 ▒ 0.00 versus 1.49 ▒ 0.50, P = 0.0286; intracellular VEGFR2, n = 4, siNC versus siRNF213 #1 = 1.00 ▒ 0.00 versus 0.59 ▒ 0.06, P = 0.0286; siNC versus siRNF213 #2 = 1.00 ▒ 0.00 versus 0.44 ▒ 0.04, P = 0.0286). (C) Analysis of the VEGFR2 protein distribution between siNC- and siRNF213-treated HBMECs. Scale bar = 20 Ám. (D) Quantitative analysis of nuclear TAZ, nuclear YAP, and surface VEGFR2 protein levels in siNC-, siRNF213?, siNC+YAP/TAZ inhibitor-1?, and siRNF213+YAP/TAZ inhibitor-1-treated HBMECs (nuclear TAZ, n = 4, siNC versus siRNF213 = 1.00 ▒ 0.00 versus 1.11 ▒ 0.11, P = 0.0286; siNC+YAP/TAZ inhibitor-1 versus siRNF213+YAP/TAZ inhibitor-1 = 0.43 ▒ 0.05 versus 0.56 ▒ 0.06, P = 0.0286; nuclear YAP, n = 4, siNC versus siRNF213 = 1.00 ▒ 0.00 versus 1.46 ▒ 0.26, P = 0.0286; siNC+YAP/TAZ inhibitor-1 versus siRNF213+YAP/TAZ inhibitor-1 = 0.36 ▒ 0.03 versus 0.50 ▒ 0.04, P = 0.0286; surface VEGFR2, n = 4, siNC versus siRNF213 = 1.00 ▒ 0.00 versus 1.28 ▒ 0.17, P = 0.0286; siNC+YAP/TAZ inhibitor-1 versus siRNF213+YAP/TAZ inhibitor-1 = 0.36 ▒ 0.10 versus 0.56 ▒ 0.07, P = 0.0286). (E) Quantitative analysis of TAZ mRNA levels in normal HBMECs incubated with VEGF165 (5 ng/ml) at 0, 1, 2, 3, 4.5 and 6 h (n = 3, 1.00 ▒ 0.04 versus 1.24 ▒ 0.10 versus 1.42 ▒ 0.07 versus 0.92 ▒ 0.07 versus 0.68 ▒ 0.02 versus 0.72 ▒ 0.14, P = 0.0086, Kruskal?Wallis statistic =15.46). (F) A tube formation assay was conducted to measure angiogenesis in siRNF213-treated HBMECs after incubation with a YAP/TAZ inhibitor and/or VEGF165. Scale bar = 100 Ám. (G) AngioTool software was used to automatically detect the vessel length and junctions. The siRNF213-transfected HBMECs treated with a YAP/TAZ inhibitor showed significant reductions in the vessel area (n = 6, 1.00 ▒ 0.07 versus 1.69 ▒ 0.21 versus 0.59 ▒ 0.08 versus 0.89 ▒ 0.03, P = 0.0005, Kruskal?Wallis statistic =17.58), vessel density (n = 6, 1.00 ▒ 0.02 versus 1.66 ▒ 0.17 versus 0.60 ▒ 0.07 versus 0.86 ▒ 0.03, P = 0.0005, Kruskal?Wallis statistic =17.86), vessel length (n = 6, 1.00 ▒ 0.41 versus 2.57 ▒ 0.76 versus 0.36 ▒ 0.20 versus 0.59 ▒ 0.34, P = 0.0044, Kruskal?Wallis statistic =13.09), total number of junctions (n = 6, 1.00 ▒ 0.15 versus 2.11 ▒ 0.40 versus 0.47 ▒ 0.11 versus 0.71 ▒ 0.15, P = 0.0007, Kruskal?Wallis statistic =16.91), junction density (n = 6, 1.00 ▒ 0.12 versus 2.08 ▒ 0.36 versus 0.48 ▒ 0.13 versus 0.69 ▒ 0.14, P = 0.0009, Kruskal?Wallis statistic =16.51), and branching index (n = 6, 1.00 ▒ 0.10 versus 1.73 ▒ 0.24 versus 0.54 ▒ 0.07 versus 0.77 ▒ 0.08, P = 0.0005, Kruskal?Wallis statistic =17.86) compared to those of siRNF213-transfected HBMECs treated with VEGF165. Each dot represents one sample. The means ▒ SDs are shown. The dashed line indicates the region of interest. *P < 0.05, **P < 0.01, ***P < 0.001, ****P < 0.0001. |
|
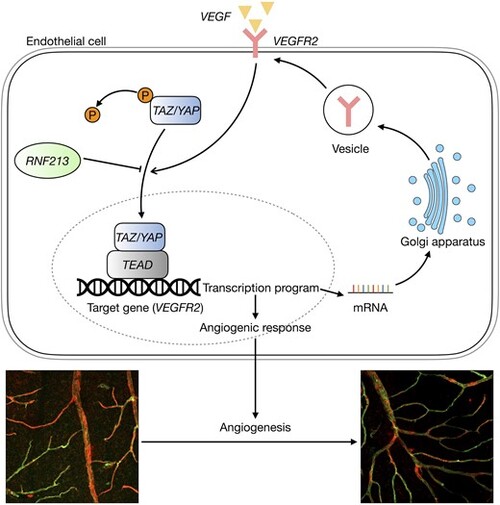
Schematic showing the mechanism by which RNF213 loss-of-function mutations regulate the Hippo signalling pathway in endothelial cells. Green = IB-4; red = ?-SMA. |

ZFIN is incorporating published figure images and captions as part of an ongoing project. Figures from some publications have not yet been curated, or are not available for display because of copyright restrictions. |

