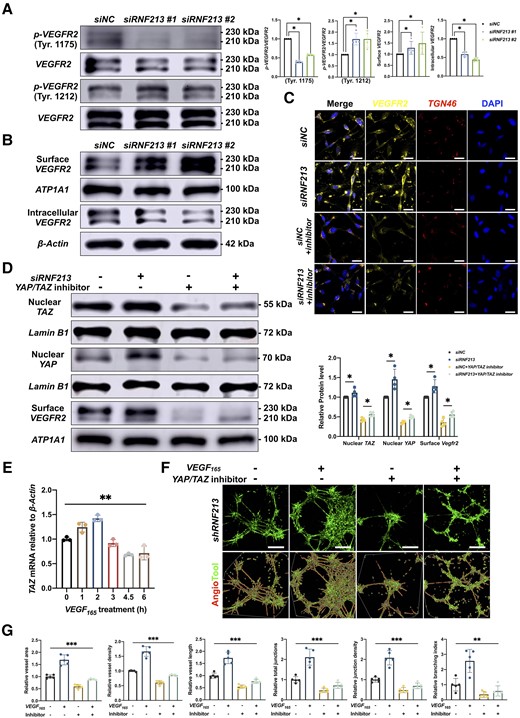
Fig. 7 Inhibition of YAP/TAZ expression reverses RNF213-induced angiogenesis. (A) Quantitative analysis of the p-VEGFR2/VEGFR2 protein ratio in siNC- and siRNF213-treated HBMECs (Tyr.1175, n = 4, siNC versus siRNF213 #1 = 1.00 ▒ 0.00 versus 0.39 ▒ 0.03, P = 0.0286; siNC versus siRNF213 #2 = 1.00 ▒ 0.00 versus 0.57 ▒ 0.02, P = 0.0286; Tyr.1212, n = 4, siNC versus siRNF213 #1 = 1.00 ▒ 0.00 versus 1.69 ▒ 0.26, P = 0.0286; siNC versus siRNF213 #2 = 1.00 ▒ 0.00 versus 1.70 ▒ 0.37, P = 0.0286). (B) Quantitative analysis of surface and intracellular VEGFR2 protein levels between siNC- and siRNF213-treated HBMECs (surface VEGFR2, n = 4, siNC versus siRNF213 #1 = 1.00 ▒ 0.00 versus 1.28 ▒ 0.29, P = 0.0286; siNC versus siRNF213 #2 = 1.00 ▒ 0.00 versus 1.49 ▒ 0.50, P = 0.0286; intracellular VEGFR2, n = 4, siNC versus siRNF213 #1 = 1.00 ▒ 0.00 versus 0.59 ▒ 0.06, P = 0.0286; siNC versus siRNF213 #2 = 1.00 ▒ 0.00 versus 0.44 ▒ 0.04, P = 0.0286). (C) Analysis of the VEGFR2 protein distribution between siNC- and siRNF213-treated HBMECs. Scale bar = 20 Ám. (D) Quantitative analysis of nuclear TAZ, nuclear YAP, and surface VEGFR2 protein levels in siNC-, siRNF213?, siNC+YAP/TAZ inhibitor-1?, and siRNF213+YAP/TAZ inhibitor-1-treated HBMECs (nuclear TAZ, n = 4, siNC versus siRNF213 = 1.00 ▒ 0.00 versus 1.11 ▒ 0.11, P = 0.0286; siNC+YAP/TAZ inhibitor-1 versus siRNF213+YAP/TAZ inhibitor-1 = 0.43 ▒ 0.05 versus 0.56 ▒ 0.06, P = 0.0286; nuclear YAP, n = 4, siNC versus siRNF213 = 1.00 ▒ 0.00 versus 1.46 ▒ 0.26, P = 0.0286; siNC+YAP/TAZ inhibitor-1 versus siRNF213+YAP/TAZ inhibitor-1 = 0.36 ▒ 0.03 versus 0.50 ▒ 0.04, P = 0.0286; surface VEGFR2, n = 4, siNC versus siRNF213 = 1.00 ▒ 0.00 versus 1.28 ▒ 0.17, P = 0.0286; siNC+YAP/TAZ inhibitor-1 versus siRNF213+YAP/TAZ inhibitor-1 = 0.36 ▒ 0.10 versus 0.56 ▒ 0.07, P = 0.0286). (E) Quantitative analysis of TAZ mRNA levels in normal HBMECs incubated with VEGF165 (5 ng/ml) at 0, 1, 2, 3, 4.5 and 6 h (n = 3, 1.00 ▒ 0.04 versus 1.24 ▒ 0.10 versus 1.42 ▒ 0.07 versus 0.92 ▒ 0.07 versus 0.68 ▒ 0.02 versus 0.72 ▒ 0.14, P = 0.0086, Kruskal?Wallis statistic =15.46). (F) A tube formation assay was conducted to measure angiogenesis in siRNF213-treated HBMECs after incubation with a YAP/TAZ inhibitor and/or VEGF165. Scale bar = 100 Ám. (G) AngioTool software was used to automatically detect the vessel length and junctions. The siRNF213-transfected HBMECs treated with a YAP/TAZ inhibitor showed significant reductions in the vessel area (n = 6, 1.00 ▒ 0.07 versus 1.69 ▒ 0.21 versus 0.59 ▒ 0.08 versus 0.89 ▒ 0.03, P = 0.0005, Kruskal?Wallis statistic =17.58), vessel density (n = 6, 1.00 ▒ 0.02 versus 1.66 ▒ 0.17 versus 0.60 ▒ 0.07 versus 0.86 ▒ 0.03, P = 0.0005, Kruskal?Wallis statistic =17.86), vessel length (n = 6, 1.00 ▒ 0.41 versus 2.57 ▒ 0.76 versus 0.36 ▒ 0.20 versus 0.59 ▒ 0.34, P = 0.0044, Kruskal?Wallis statistic =13.09), total number of junctions (n = 6, 1.00 ▒ 0.15 versus 2.11 ▒ 0.40 versus 0.47 ▒ 0.11 versus 0.71 ▒ 0.15, P = 0.0007, Kruskal?Wallis statistic =16.91), junction density (n = 6, 1.00 ▒ 0.12 versus 2.08 ▒ 0.36 versus 0.48 ▒ 0.13 versus 0.69 ▒ 0.14, P = 0.0009, Kruskal?Wallis statistic =16.51), and branching index (n = 6, 1.00 ▒ 0.10 versus 1.73 ▒ 0.24 versus 0.54 ▒ 0.07 versus 0.77 ▒ 0.08, P = 0.0005, Kruskal?Wallis statistic =17.86) compared to those of siRNF213-transfected HBMECs treated with VEGF165. Each dot represents one sample. The means ▒ SDs are shown. The dashed line indicates the region of interest. *P < 0.05, **P < 0.01, ***P < 0.001, ****P < 0.0001.
Image
Figure Caption
Acknowledgments
This image is the copyrighted work of the attributed author or publisher, and
ZFIN has permission only to display this image to its users.
Additional permissions should be obtained from the applicable author or publisher of the image.
Full text @ Brain

