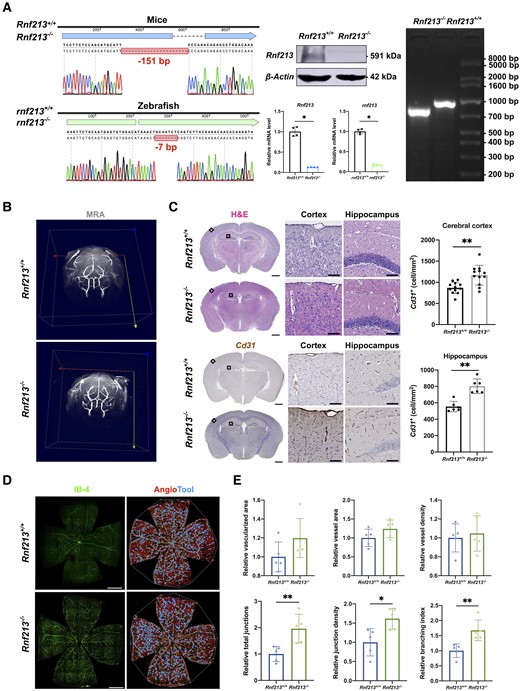
Fig. 2 RNF213 deletion promotes pathological angiogenesis in vivo. (A) Sanger sequencing revealed a 151-bp deletion in mice and a 7-bp deletion in zebrafish. Western blots of mouse brain tissues validated an ?90% decrease in Rnf213 expression in Rnf213?/? mice (n = 4, 1.00 ▒ 0.00 versus 0.07 ▒ 0.02, P = 0.0286). Quantitative RT-PCR confirmed the significantly reduced gene expression levels (Rnf213, n = 4, 1.00 ▒ 0.11 versus 0.13 ▒ 0.01, P = 0.0286; rnf213, n = 4, 0.99 ▒ 0.06 versus 0.17 ▒ 0.02, P = 0.0286). Agarose gel electrophoresis further confirmed this homozygous mutation in mice. (B) No significant differences in steno-occlusive arteries in the major branches of the Willis circle were observed between Rnf213+/+ and Rnf213?/? mice using 7.0 T magnetic resonance angiography. (C) The complete structure of the cerebral vessels was stained with haematoxylin and eosin (H&E) and subjected to immunohistochemistry. From each section, one similar region of the hippocampus and three similar cortical regions in the unilateral cerebral hemisphere were randomly selected. The Rnf213?/? mice showed a significantly increased vessel density in both the cerebral cortex (n = 12, 868.77 ▒ 133.61 versus 1167.60 ▒ 234.25 cell/mm2, P = 0.0011) and hippocampus (n = 6, 554.19 ▒ 63.98 versus 802.66 ▒ 88.41 cell/mm2, P = 0.0022). Scale bar = 1 mm (left); scale bar = 100 Ám (right). (D) Vessels throughout the retinas from Rnf213+/+ and Rnf213?/? mice were labelled with IB-4. AngioTool software was used to automatically detect the vessel length (red) and junctions (blue). Scale bar = 500 Ám. (E) No significant differences in the relative vascularized area (n = 5, 1.00 ▒ 0.16 versus 1.20 ▒ 0.21, P = 0.0952), vessel area (n = 5, 1.00 ▒ 0.23 versus 1.24 ▒ 0.23, P = 0.2222), and vessel density (n = 5, 1.00 ▒ 0.15 versus 1.05 ▒ 0.19, P > 0.9999) were observed between Rnf213+/+ and Rnf213?/? mice. Compared to Rnf213+/+ mice, Rnf213?/? mice showed significantly increased total junction numbers (n = 5, 1.00 ▒ 0.29 versus 1.96 ▒ 0.54, P = 0.0079), junction density (n = 5, 1.00 ▒ 0.35 versus 1.62 ▒ 0.27, P = 0.0159), and branch numbers (n = 5, 1.00 ▒ 0.25 versus 1.67 ▒ 0.34, P = 0.0079). Each dot represents one sample. The means ▒ SDs are shown. The dashed line indicates the region of interest. *P < 0.05, **P < 0.01, ***P < 0.001 and ****P < 0.0001.
Image
Figure Caption
Acknowledgments
This image is the copyrighted work of the attributed author or publisher, and
ZFIN has permission only to display this image to its users.
Additional permissions should be obtained from the applicable author or publisher of the image.
Full text @ Brain

