Fig. 3
|
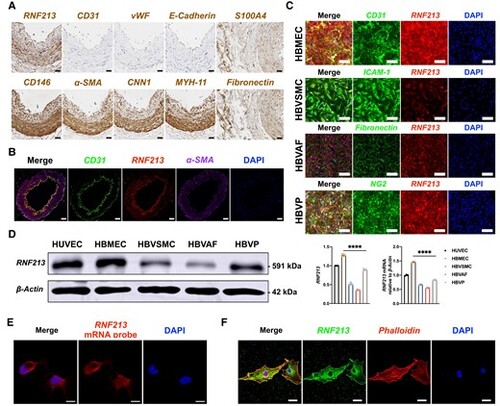
Human brain microvascular endothelial cells (HBMECs) are the major sources of RNF213. (A) Immunohistochemistry staining of donor superficial temporal artery sections from patients with intracranial aneurysm (IA). The RNF213 protein was expressed in all of the vascular walls. Endothelial markers [CD31, von Willebrand factor (vWF) and E-cadherin] were obviously located inside the vascular wall. Smooth muscle markers [?-SMA,calponin-1 (CNN1), smooth muscle myosin heavy chain 11 (MYH-11)] and pericyte markers (CD146 and ?-SMA) were expressed mainly in the tunica media. Fibroblast markers (fibronectin and S100A4) were expressed mainly in the tunica adventitia. Scale bar = 20 Ám. (B) The RNF213 protein co-localized with CD31 in the vascular wall. Scale bar = 50 Ám. (C) The RNF213 protein was expressed at higher levels in human brain microvascular endothelial cells (HBMECs) and human brain vascular pericytes (HBVPs) than in human brain vascular adventitial fibroblasts (HBVAFs) or human brain vascular smooth muscle cells (HBVSMCs). Scale bar = 100 Ám. (D) Using human umbilical vein endothelial cells (HUVECs) as controls, western blots revealed significantly higher RNF213 protein expression levels in HBMECs than in other cells (n = 4, 1.28 ▒ 0.03 versus 0.52 ▒ 0.03 versus 0.36 ▒ 0.01 versus 0.89 ▒ 0.02, P < 0.0001, Kruskal?Wallis statistic =14.12), which was confirmed by performing a qRT-PCR analysis (n = 3, 1.47 ▒ 0.03 versus 0.67 ▒ 0.02 versus 0.56 ▒ 0.02 versus 0.84 ▒ 0.02, P < 0.0001, Kruskal?Wallis statistic =10.38). (E) RNF213 is mainly expressed in the cytoplasm of HBMECs, as shown by fluorescent in situ hybridization. Scale bar = 10 Ám. (F) Confocal microscopy revealed stronger RNF213 protein expression in the cytoplasm than in the nucleus. Scale bar = 20 Ám. Each dot represents one sample. The means ▒ SDs are shown. The dashed line indicates the region of interest. *P < 0.05, **P < 0.01, ***P < 0.001 and ****P < 0.0001. |

