- Title
-
The KEAP1-NRF2 pathway regulates TFEB/TFE3-dependent lysosomal biogenesis
- Authors
- Ong, A.J.S., Bladen, C.E., Tigani, T.A., Karamalakis, A.P., Evason, K.J., Brown, K.K., Cox, A.G.
- Source
- Full text @ Proc. Natl. Acad. Sci. USA
|
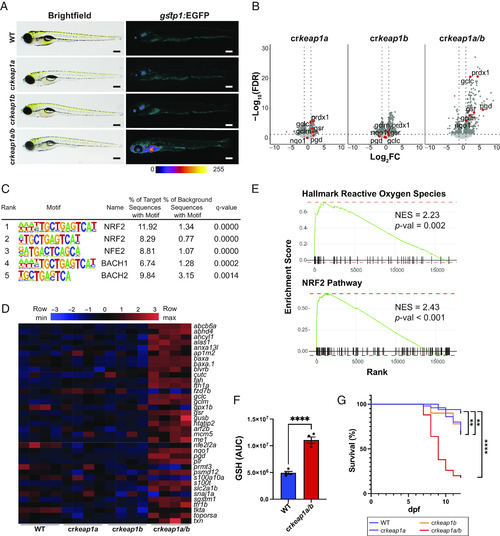
Loss of Keap1 activates Nrf2 and drives postembryonic lethality. (A) Representative whole-mount brightfield and fluorescent images of WT, crkeap1a, crkeap1b, and crkeap1a/b zebrafish on a gstp1:EGFP background at 7 days post fertilization (dpf). Fluorescent images are pseudocolored using the Fire Look-Up Table (LUT). Scale bars represent 350 µm. (B) Volcano plots of differentially expressed genes (DEGs) identified by comparing WT and crkeap1a, crkeap1b, or crkeap1a/b zebrafish at 7 dpf by RNA-Seq analysis, n = 4 pools of 10 larvae. Significant DEGs are highlighted in dark gray. Select canonical Nrf2 target genes are highlighted in red. (C) Top five enriched transcription factor-binding sites, as determined by Hypergeometric Optimization of Motif EnRichment (HOMER) motif analysis, among the genes up-regulated in crkeap1a/b zebrafish at 7 dpf. (D) Heatmap of Nrf2 target gene expression among DEGs identified in Fig. 1B. (E) Gene set enrichment analysis (GSEA) plots derived from RNA-Seq analysis of crkeap1a/b versus their WT counterparts at 7 dpf demonstrating Nrf2 pathway activation. (F) Glutathione (GSH) abundance in WT and crkeap1a/b zebrafish at 7 dpf as determined by LC-MS/MS. Data are shown as mean area under the curve (AUC) ± SEM, n = 4 pools of 10 larvae. (G) Kaplan–Meier survival plot of WT, crkeap1a, crkeap1b, and crkeap1a/b zebrafish, n = 50. For all experiments **P < 0.01, ****P < 0.0001. |
|
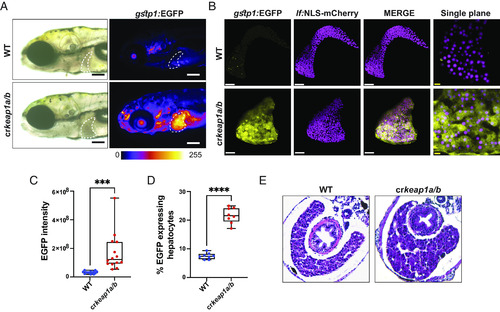
Keap1-deficient larvae exhibit defects in postembryonic liver development. (A) Representative whole-mount fluorescent images of WT and crkeap1a/b zebrafish on a gstp1:EGFP background at 7 dpf. Dashed line highlights the liver. Fluorescent images are pseudocolored using the Fire LUT. Scale bars represent 200 µm. (B) Representative Imaris-rendered multiphoton images of hepatocyte nuclei (magenta) and EGFP expression (yellow) in WT and crkeap1a/b zebrafish at 7 dpf. White scale bars represent 50 µm, yellow scale bars represent 10 µm. (C) Quantification of EGFP intensity in livers of WT and crkeap1a/b zebrafish at 7 dpf. Data are shown as mean and interquartile range, n = 14. (D) Quantification of EGFP expressing/mCherry-positive hepatocytes at 7 dpf as determined by flow cytometric analysis of larval single-cell suspensions, n= 8 pooled samples of 10 larvae. (E) Representative hematoxylin and eosin-stained transverse sections from WT and crkeap1a/b zebrafish at 7 dpf. For all experiments ***P < 0.001, ****P < 0.0001. |
|
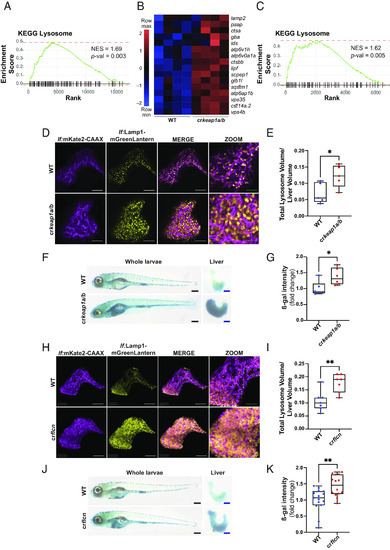
Loss of Keap1 induces lysosomal biogenesis. (A) GSEA plot, derived from RNA-Seq analysis of crkeap1a/b zebrafish versus their WT counterparts at 7 dpf, demonstrating induction of the KEGG lysosomal signature. (B) Heatmap of lysosomal genes among DEGs identified in Fig. 1B. (C) GSEA plot, derived from RNA-Seq analysis of dissected larval livers isolated from crkeap1a/b zebrafish and their WT counterparts at 7 dpf, demonstrating induction of the KEGG lysosomal signature, n = 3 pools of 15 larval livers. (D) Representative multiphoton images of hepatocyte membrane (magenta) and lysosomes (yellow) on a lf:Lamp1-mGreenLantern; lf:mKate2-CAAX background of WT and crkeap1a/b zebrafish at 7 dpf. White scale bars represent 50 µm, green scale bars represent 25 µm. (E) Quantification of lysosome volume (mGreenLantern) normalized to liver volume in D. (F) Representative images of ß-galactosidase (ß-gal)-stained whole-mount larvae (Left) and dissected larval livers (Right) of WT and crkeap1a/b zebrafish at 7 dpf. Black scale bars represent 350 µm, blue scale bars represent 100 µm. (G) Quantification of ß-gal intensity in dissected larval livers in F. (H) Representative multiphoton images of hepatocyte membrane (magenta) and lysosomes (yellow) on a lf:Lamp1-mGreenLantern; lf:mKate2-CAAX background of WT and crflcn zebrafish at 7 dpf. White scale bars represent 50 µm, green scale bars represent 25 µm. (I) Quantification of lysosome volume (mGreenLantern) normalized to liver volume in H. (J) Representative images of ß-gal-stained whole-mount larvae (Left) and dissected larval livers (Right) of WT and crflcn zebrafish at 7 dpf. Black scale bars represent 350 µm, blue scale bars represent 100 µm. (K) Quantification of of ß-gal intensity in dissected larval livers in J. For all quantification, data are shown as mean and interquartile range, *P < 0.05, **P < 0.01. |
|
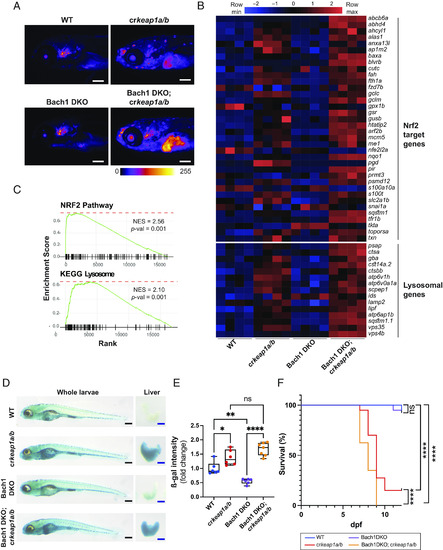
Bach1-mediated repression of Nrf2 modulates lysosomal biogenesis. (A) Representative whole-mount fluorescent images of WT, crkeap1a/b, Bach1 DKO, and Bach1 DKO; crkeap1a/b zebrafish on a gstp1:EGFP background at 7 dpf. Fluorescent images are pseudocolored using the Fire LUT. Scale bars represent 200 µm. (B) Heatmap of Nrf2 target genes and lysosomal genes in WT, crkeap1a/b, Bach1 DKO, and Bach1 DKO; crkeap1a/b zebrafish at 7 dpf as determined by RNA-Seq analysis, n = 4 pools of 10 larvae. (C) GSEA plots derived from RNA-Seq analysis of Bach1 DKO; crkeap1a/b versus Bach1 DKO zebrafish at 7 dpf demonstrating the Nrf2 pathway signature and KEGG lysosomal signature. (D) Representative images of ß-gal-stained whole-mount (Left) and dissected larval livers (Right) from WT, crkeap1a/b, Bach1 DKO, and Bach1 DKO; crkeap1a/b zebrafish at 7 dpf. Black scale bars represent 350 µm, blue scale bars represent 100 µm. (E) Quantification of ß-gal intensity in dissected larval livers represented in D. Data are shown as mean and interquartile range, n = 6 to 7. (F) Kaplan–Meier survival plot of WT, crkeap1a/b, Bach1 DKO, and Bach1 DKO; crkeap1a/b zebrafish, n = 40. For all experiments, *P < 0.05, **P < 0.01, ****P < 0.0001. |
|
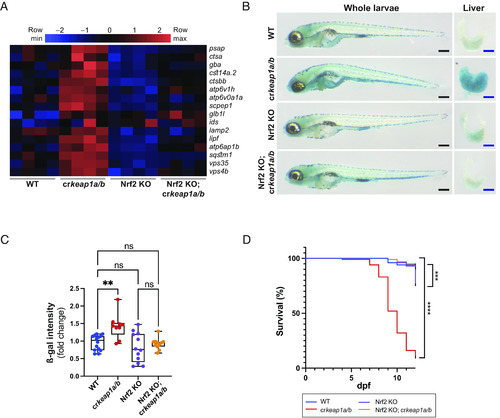
Keap1-dependent regulation of lysosomal biogenesis requires Nrf2. (A) Heatmap of lysosomal gene expression in WT, crkeap1a/b, Nrf2 KO, and Nrf2 KO; crkeap1a/b zebrafish at 7 dpf as determined by RNA-Seq analysis, n = 4 pools of 10 larvae. (B) Representative images of ß-gal-stained whole-mount larvae (Left) and dissected larval livers (Right) from WT, crkeap1a/b, Nrf2 KO, and Nrf2 KO; crkeap1a/b zebrafish at 7 dpf. Black scale bars represent 350 µm, blue scale bars represent 100 µm. (C) Quantification of ß-gal intensity in dissected livers in B. Data are shown as mean and interquartile range, n = 9 to 14 livers. (D) Kaplan–Meier survival plot of WT, crkeap1a/b, Nrf2 KO, and Nrf2 KO; crkeap1a/b zebrafish, n = 40. For all experiments, **P < 0.01, ***P < 0.001, ****P < 0.0001. |
|
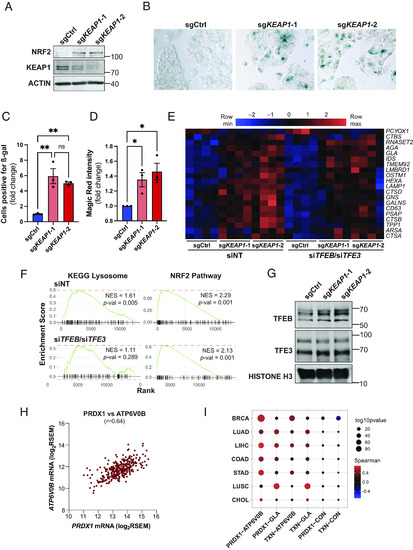
KEAP1-dependent regulation of lysosomal biogenesis is cell-autonomous and evolutionarily conserved. (A) Representative immunoblot analysis of HepG2 cells transduced with Cas9/guide RNA constructs targeting AAVS1 (sgCtrl) and |

