
|
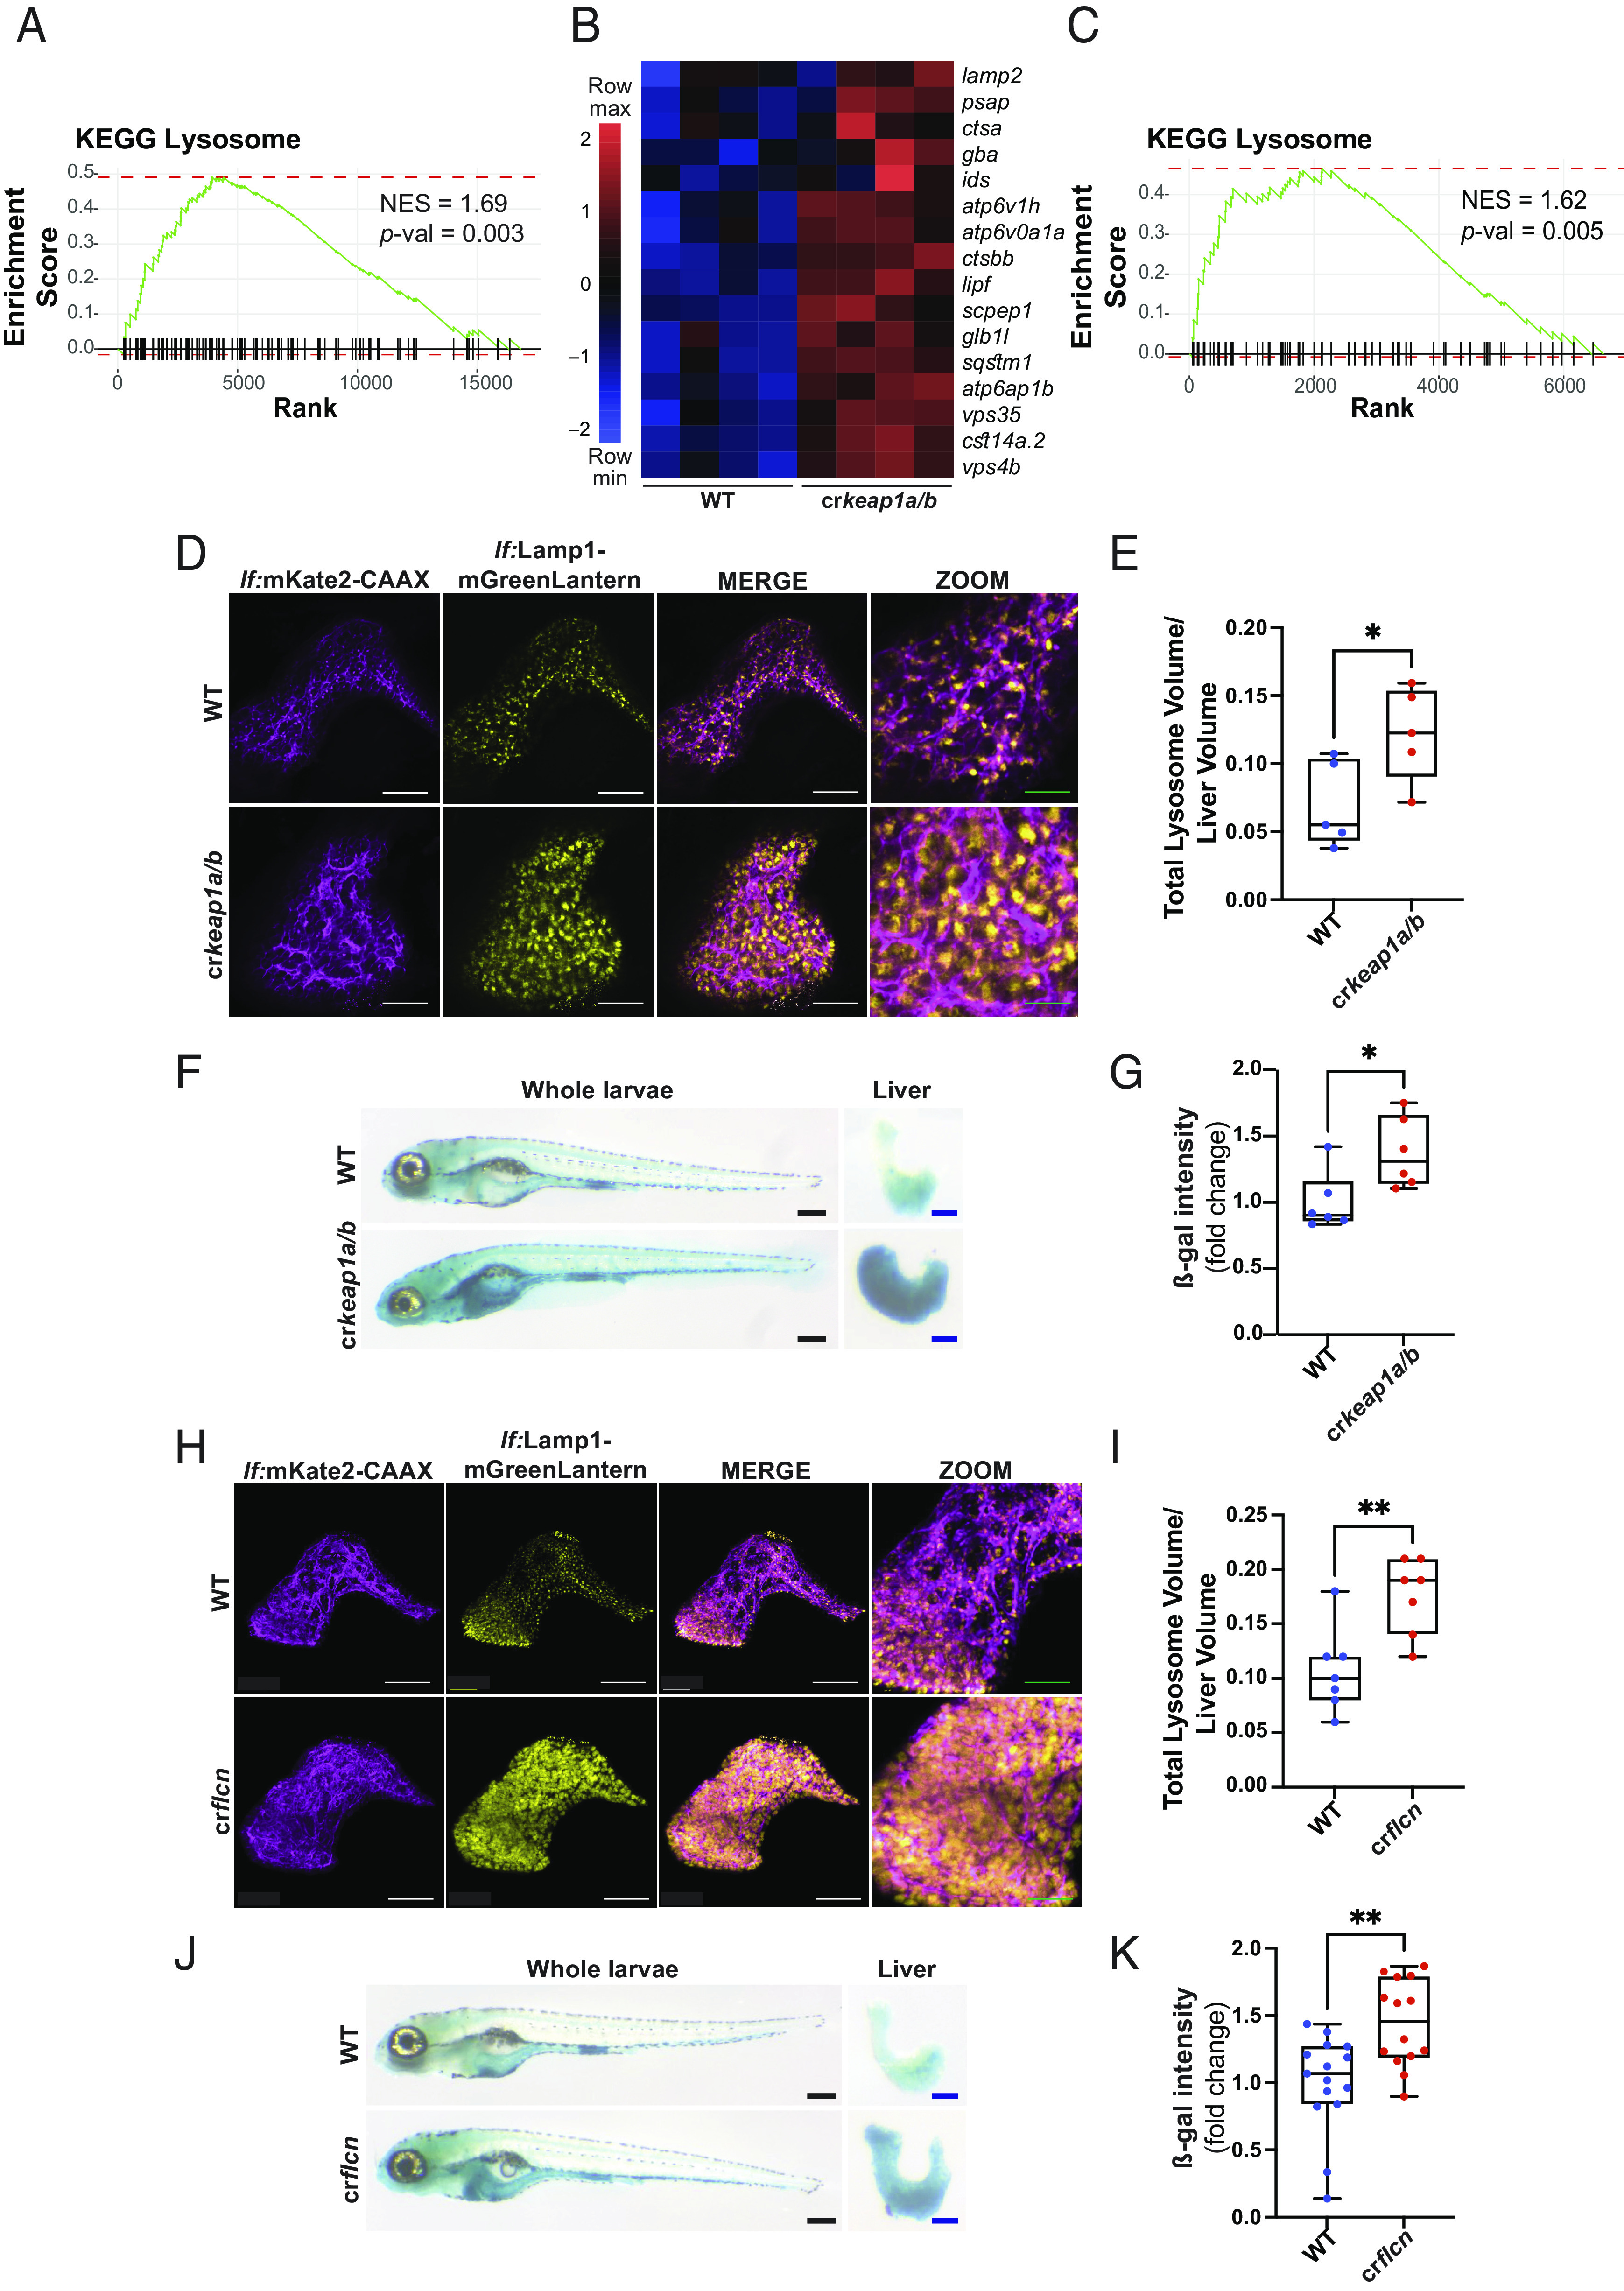
Fig. 3.
Loss of Keap1 induces lysosomal biogenesis. (A) GSEA plot, derived from RNA-Seq analysis of crkeap1a/b zebrafish versus their WT counterparts at 7 dpf, demonstrating induction of the KEGG lysosomal signature. (B) Heatmap of lysosomal genes among DEGs identified in Fig. 1B. (C) GSEA plot, derived from RNA-Seq analysis of dissected larval livers isolated from crkeap1a/b zebrafish and their WT counterparts at 7 dpf, demonstrating induction of the KEGG lysosomal signature, n = 3 pools of 15 larval livers. (D) Representative multiphoton images of hepatocyte membrane (magenta) and lysosomes (yellow) on a lf:Lamp1-mGreenLantern; lf:mKate2-CAAX background of WT and crkeap1a/b zebrafish at 7 dpf. White scale bars represent 50 µm, green scale bars represent 25 µm. (E) Quantification of lysosome volume (mGreenLantern) normalized to liver volume in D. (F) Representative images of ß-galactosidase (ß-gal)-stained whole-mount larvae (Left) and dissected larval livers (Right) of WT and crkeap1a/b zebrafish at 7 dpf. Black scale bars represent 350 µm, blue scale bars represent 100 µm. (G) Quantification of ß-gal intensity in dissected larval livers in F. (H) Representative multiphoton images of hepatocyte membrane (magenta) and lysosomes (yellow) on a lf:Lamp1-mGreenLantern; lf:mKate2-CAAX background of WT and crflcn zebrafish at 7 dpf. White scale bars represent 50 µm, green scale bars represent 25 µm. (I) Quantification of lysosome volume (mGreenLantern) normalized to liver volume in H. (J) Representative images of ß-gal-stained whole-mount larvae (Left) and dissected larval livers (Right) of WT and crflcn zebrafish at 7 dpf. Black scale bars represent 350 µm, blue scale bars represent 100 µm. (K) Quantification of of ß-gal intensity in dissected larval livers in J. For all quantification, data are shown as mean and interquartile range, *P < 0.05, **P < 0.01.