Fig. 6.
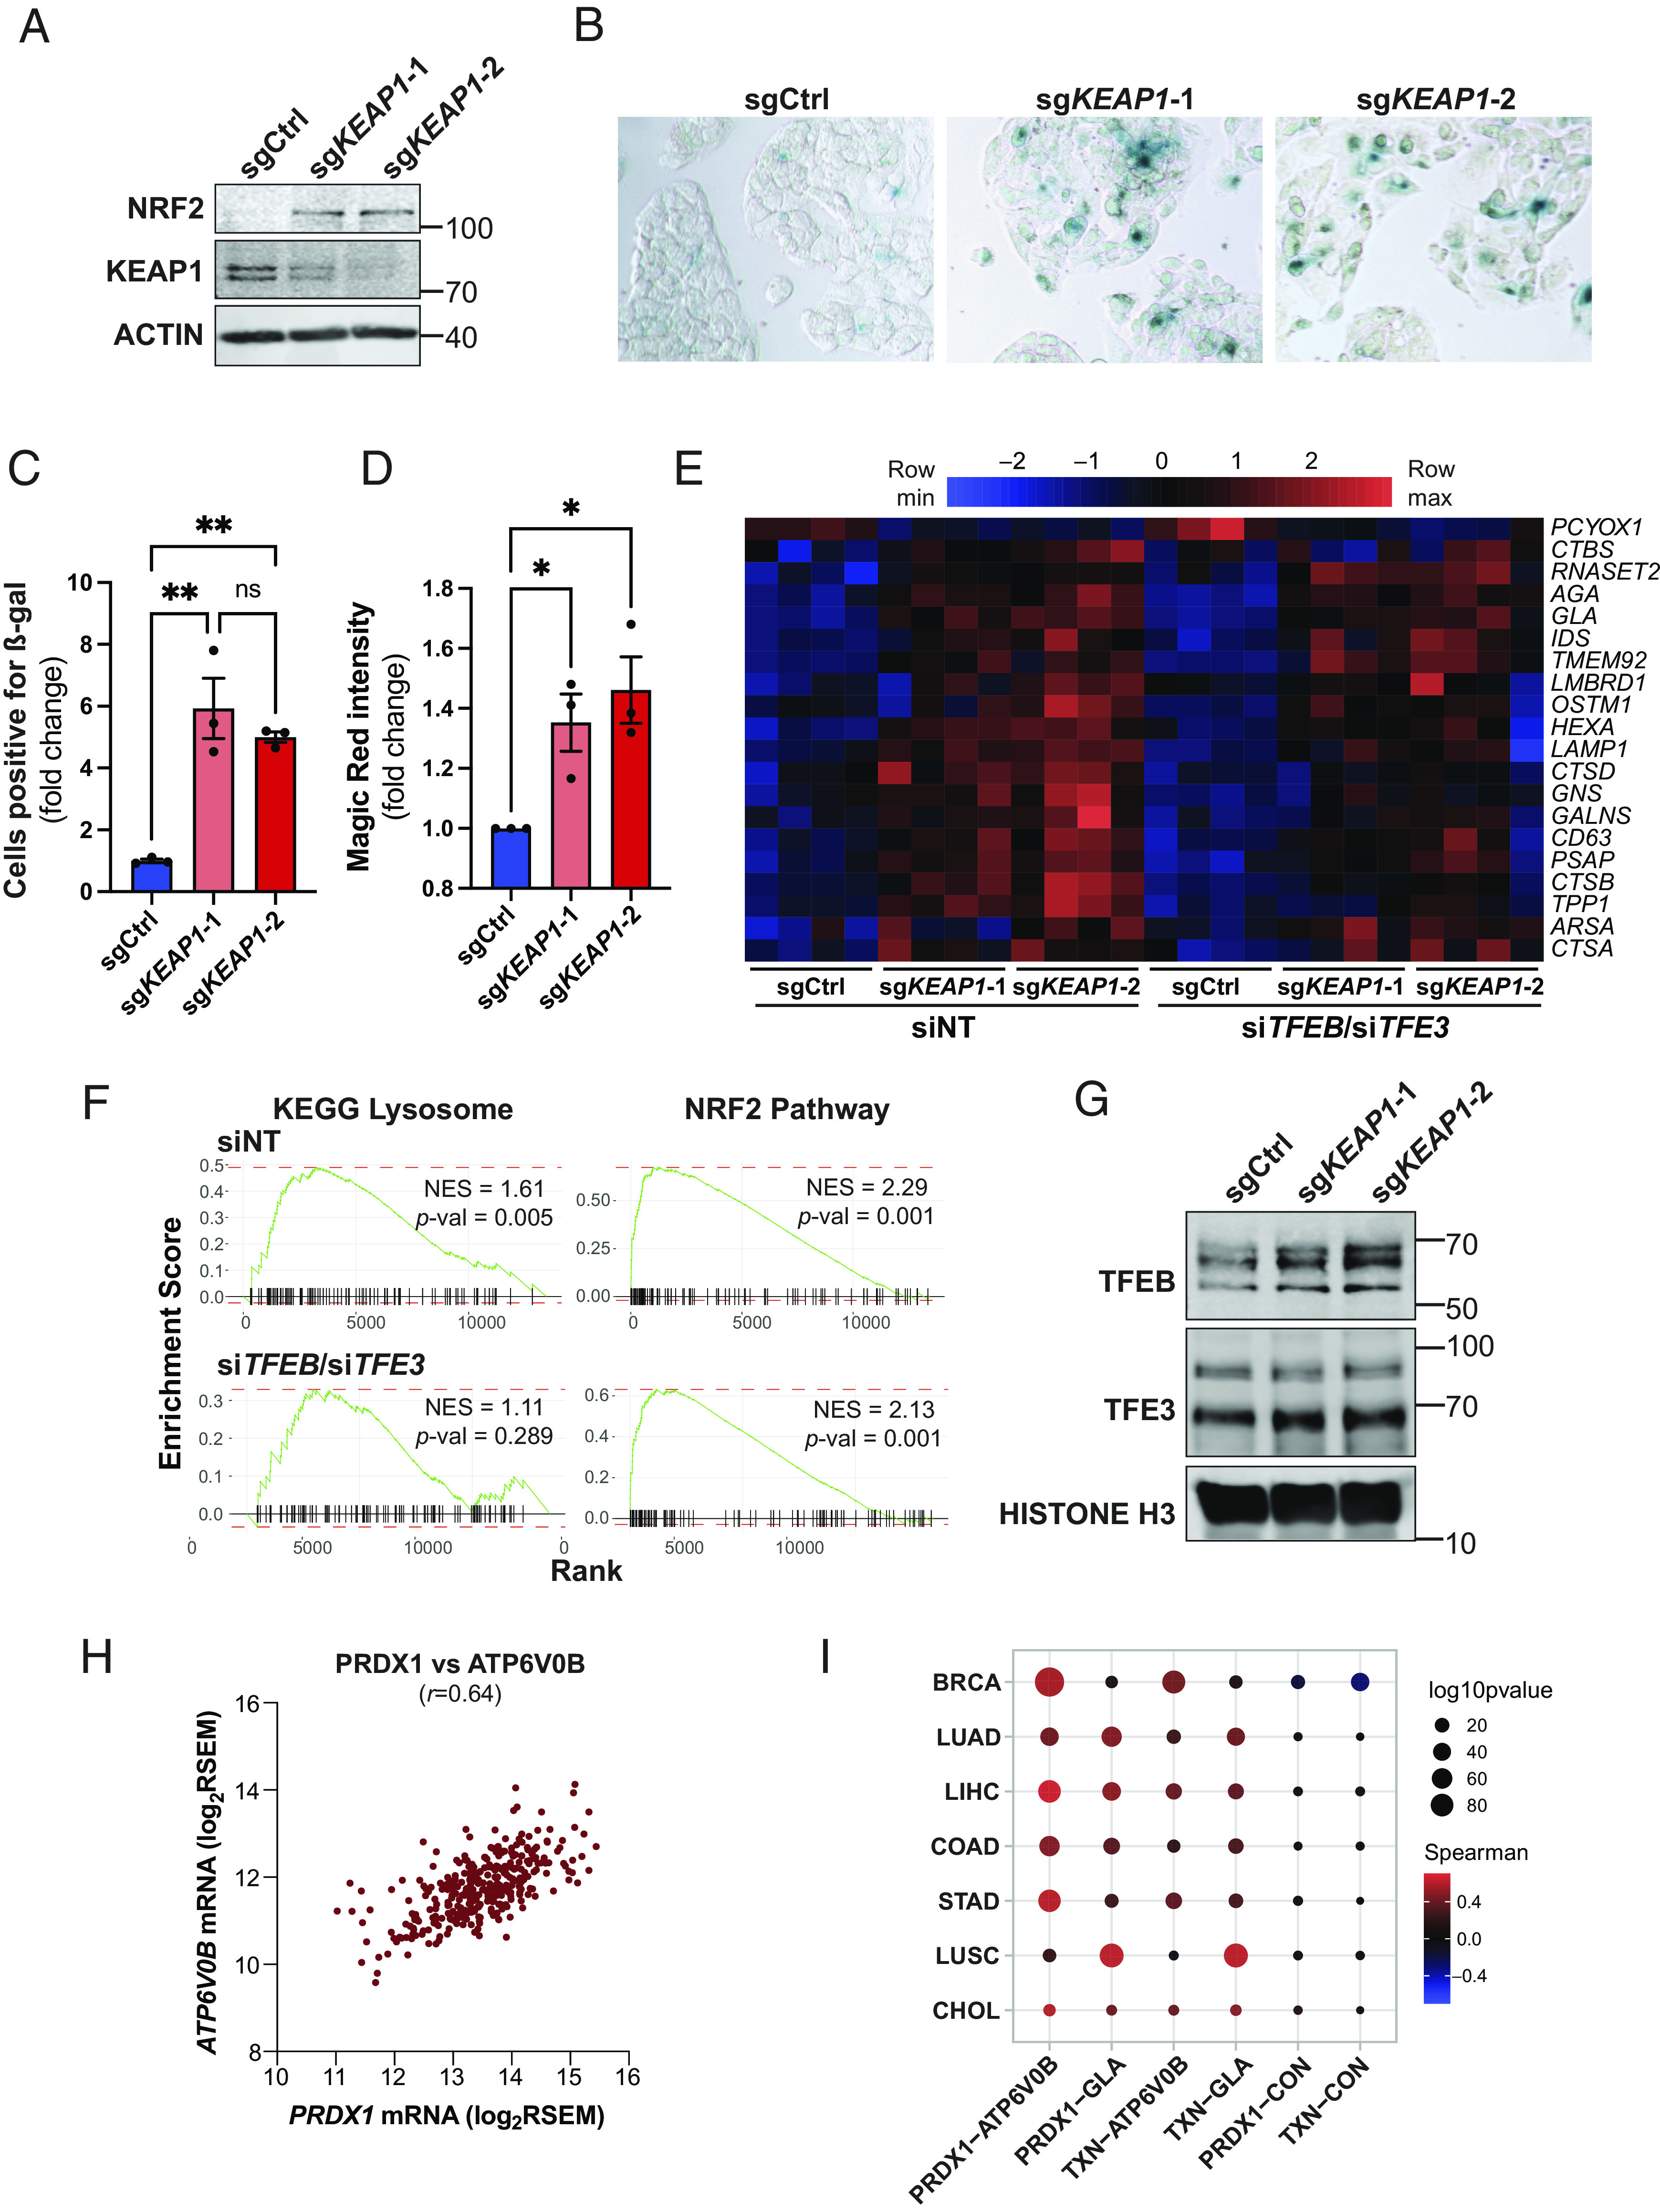
KEAP1-dependent regulation of lysosomal biogenesis is cell-autonomous and evolutionarily conserved. (A) Representative immunoblot analysis of HepG2 cells transduced with Cas9/guide RNA constructs targeting AAVS1 (sgCtrl) and KEAP1 (sgKEAP1-1, sgKEAP1-2). (B) Representative images of ß-gal-stained sgCtrl, sgKEAP1-1, and sgKEAP1-2 HepG2 cells. (C) Quantification of ß-gal-positive cells in sgKEAP1-1, and sgKEAP1-2 HepG2 cells relative to sgCtrl cells. Data are shown as mean ± SEM, n = 3. (D) Quantification of Magic Red fluorescence intensity in sgKEAP1-1, and sgKEAP1-2 HepG2 cells relative to sgCtrl cells. Data are shown as mean ± SEM, n = 3. (E) Heatmap of lysosomal gene expression in sgCtrl, sgKEAP1-1, and sgKEAP1-2 HepG2 cells transfected with either non-targeting siRNAs (siNT) or siRNAs targeting TFEB and TFE3 (siTFEB/siTFE3) as determined by RNA-Seq analysis, n = 4. (F) GSEA plots derived from RNA-Seq analysis of sgKEAP1-2 versus sgCtrl cells transfected with either siNT or siTFEB/siTFE3 demonstrating the KEGG lysosome pathway and Nrf2 pathway signatures. (G) Representative immunoblot analysis of nuclear fractions isolated from sgCtrl, sgKEAP1-1, and sgKEAP1-2 HepG2 cells. (H) Dot plot showing a correlation between PRDX1 and ATP6V0B mRNA expression in the TCGA Liver Hepatocellular Carcinoma (LIHC) dataset. (I) Spearman’s rank-order correlation of expression of the Nrf2 target genes PRDX1 and TXN with the lysosomal genes ATP6V0B and GLA in TCGA datasets.