
Fig. 1.
- ID
- ZDB-FIG-230605-31
- Publication
- Ong et al., 2023 - The KEAP1-NRF2 pathway regulates TFEB/TFE3-dependent lysosomal biogenesis
- Other Figures
- All Figure Page
- Back to All Figure Page
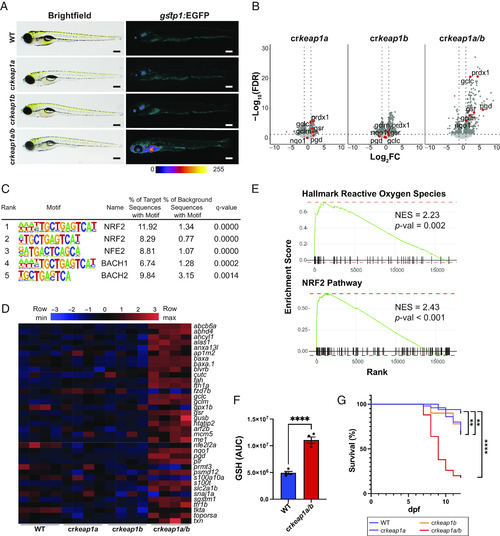
Loss of Keap1 activates Nrf2 and drives postembryonic lethality. (A) Representative whole-mount brightfield and fluorescent images of WT, crkeap1a, crkeap1b, and crkeap1a/b zebrafish on a gstp1:EGFP background at 7 days post fertilization (dpf). Fluorescent images are pseudocolored using the Fire Look-Up Table (LUT). Scale bars represent 350 µm. (B) Volcano plots of differentially expressed genes (DEGs) identified by comparing WT and crkeap1a, crkeap1b, or crkeap1a/b zebrafish at 7 dpf by RNA-Seq analysis, n = 4 pools of 10 larvae. Significant DEGs are highlighted in dark gray. Select canonical Nrf2 target genes are highlighted in red. (C) Top five enriched transcription factor-binding sites, as determined by Hypergeometric Optimization of Motif EnRichment (HOMER) motif analysis, among the genes up-regulated in crkeap1a/b zebrafish at 7 dpf. (D) Heatmap of Nrf2 target gene expression among DEGs identified in Fig. 1B. (E) Gene set enrichment analysis (GSEA) plots derived from RNA-Seq analysis of crkeap1a/b versus their WT counterparts at 7 dpf demonstrating Nrf2 pathway activation. (F) Glutathione (GSH) abundance in WT and crkeap1a/b zebrafish at 7 dpf as determined by LC-MS/MS. Data are shown as mean area under the curve (AUC) ± SEM, n = 4 pools of 10 larvae. (G) Kaplan–Meier survival plot of WT, crkeap1a, crkeap1b, and crkeap1a/b zebrafish, n = 50. For all experiments **P < 0.01, ****P < 0.0001. |