
|
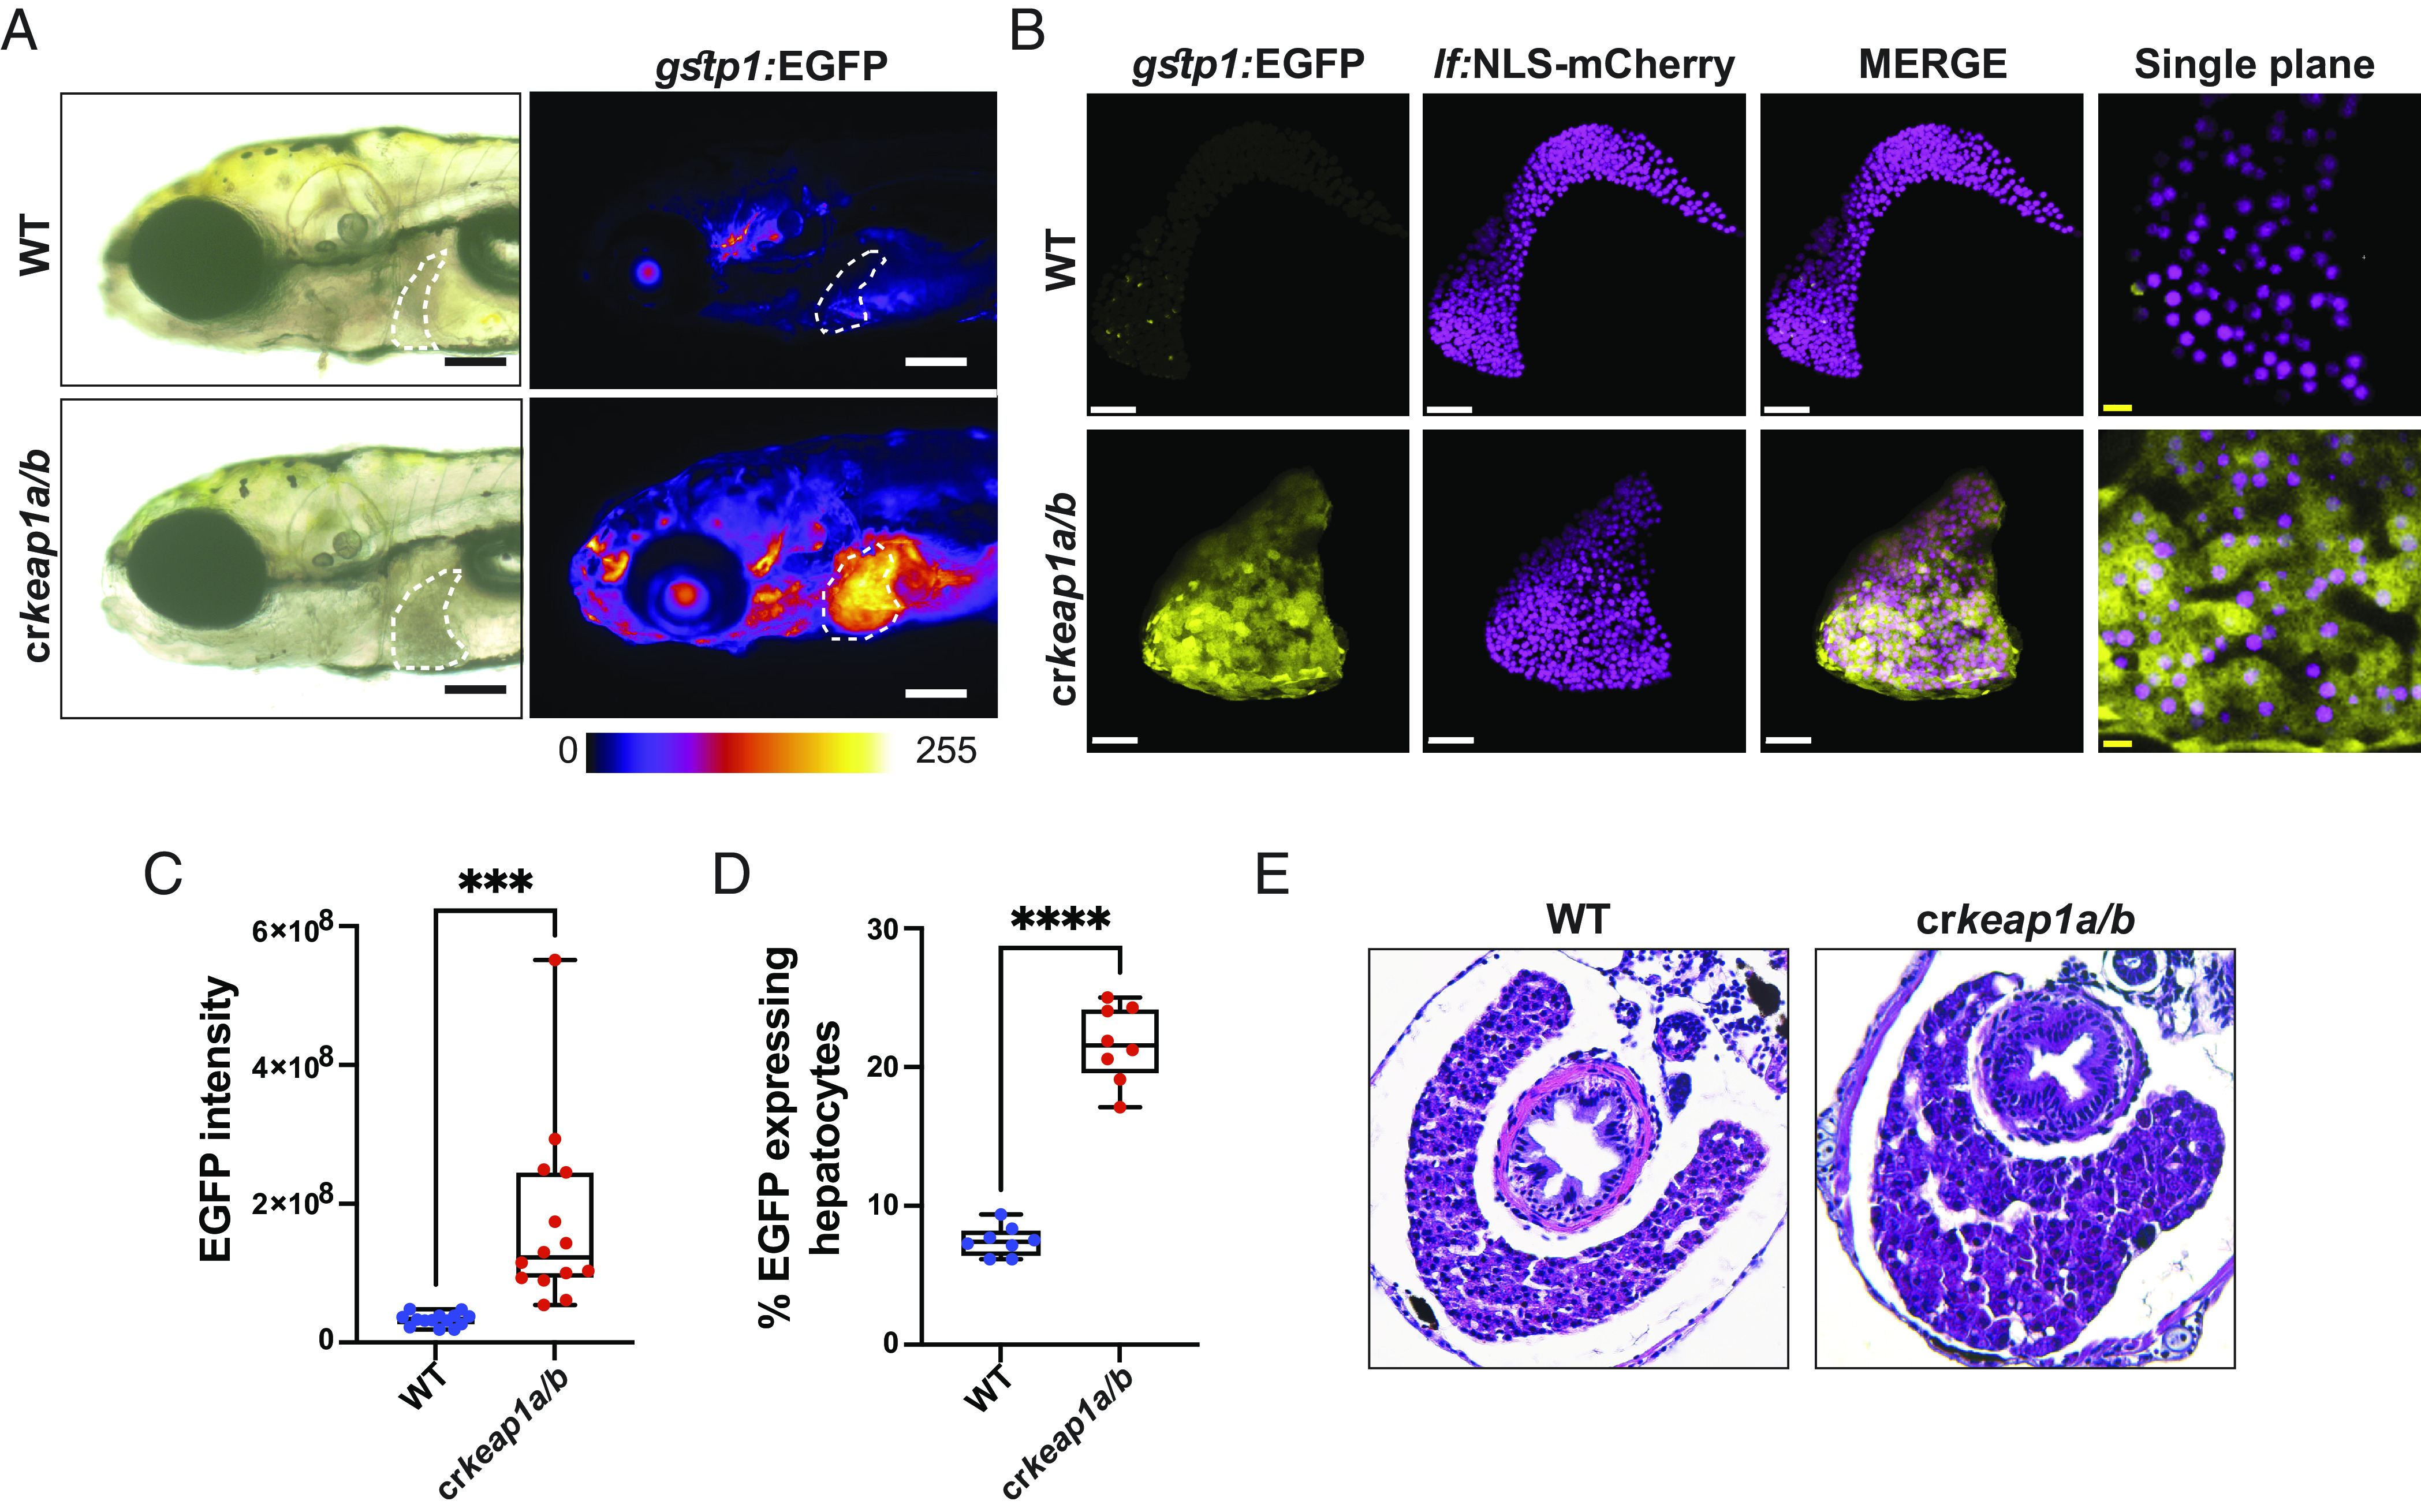
Fig. 2.
Keap1-deficient larvae exhibit defects in postembryonic liver development. (A) Representative whole-mount fluorescent images of WT and crkeap1a/b zebrafish on a gstp1:EGFP background at 7 dpf. Dashed line highlights the liver. Fluorescent images are pseudocolored using the Fire LUT. Scale bars represent 200 µm. (B) Representative Imaris-rendered multiphoton images of hepatocyte nuclei (magenta) and EGFP expression (yellow) in WT and crkeap1a/b zebrafish at 7 dpf. White scale bars represent 50 µm, yellow scale bars represent 10 µm. (C) Quantification of EGFP intensity in livers of WT and crkeap1a/b zebrafish at 7 dpf. Data are shown as mean and interquartile range, n = 14. (D) Quantification of EGFP expressing/mCherry-positive hepatocytes at 7 dpf as determined by flow cytometric analysis of larval single-cell suspensions, n= 8 pooled samples of 10 larvae. (E) Representative hematoxylin and eosin-stained transverse sections from WT and crkeap1a/b zebrafish at 7 dpf. For all experiments ***P < 0.001, ****P < 0.0001.