
- Title
-
Induction of Wnt signaling antagonists and p21-activated kinase enhances cardiomyocyte proliferation during zebrafish heart regeneration
- Authors
- Peng, X., Lai, K.S., She, P., Kang, J., Wang, T., Li, G., Zhou, Y., Sun, J., Jin, D., Xu, X., Liao, L., Liu, J., Lee, E., Poss, K.D., Zhong, T.P.
- Source
- Full text @ J. Mol. Cell Biol.
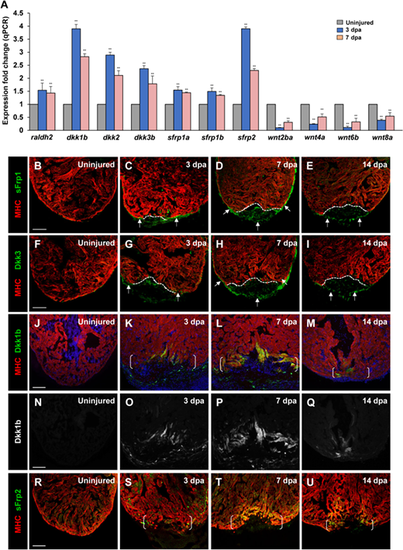
Multiple secreted Wnt inhibitors sFrps and Dkks are induced following cardiac injury. (A) Expression levels of wnt inhibitors (dkk1b, dkk2, dkk3b, sfrp1a, sfrp1b, and sfrp2) and wnt ligands (wnt2ba, wnt4a, wnt6b, and wnt8a) during cardiac regeneration. raldh2 was used as a positive control (Kikuchi et al., 2011). Data are mean � SEM from three biological replicates and three technical replicates. Student?s t-test, **P? |
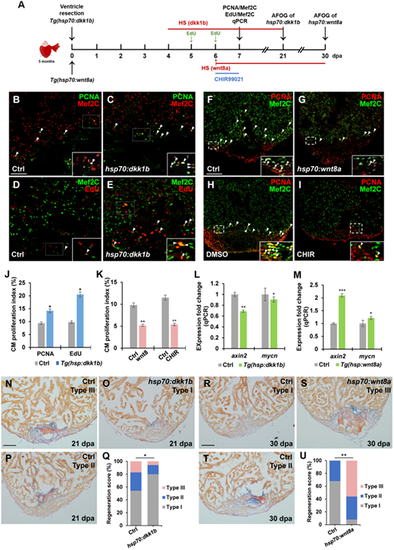
Suppression of Wnt signaling enhances heart regeneration by increasing CM proliferation. (A) Schematic of heat shock experiments and Wnt agonist treatment for CM proliferation, qPCR, and AFOG analyses. Heat shock (HS): 37�C for 2 h for control and Tg(hsp70:dkk1b) animals at 4, 5, and 6 dpa for PCNA/Mef2C assay or over the time period from 4 to 21 dpa for AFOG analysis; 37�C for 4 h for control and Tg(hsp70:wnt8a) animals at 6 dpa for PCNA/Mef2C assay or over the time period from 6 to 30 dpa for AFOG analysis. EdU: injection at 5 and 6 dpa. CHIR99021: 20 �M (in DMSO) from 6 to 7 dpa. Control: 0.1% DMSO from 6 to 7 dpa. (B?I) Confocal microscopy analyses for CM proliferation. Insets show high-magnification images in rectangles. Scale bar, 100 �m. Data are mean � SEM from five hearts each. Student?s t-test, *P? |
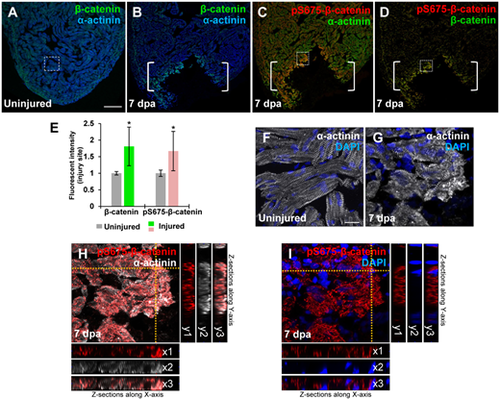
Induction of pS675-?-catenin at disassembled sarcomeres in the injured myocardium following cardiac damage. (A) In uninjured hearts, ?-catenin is detectable throughout the myocardium stained with a sarcomeric Z-disk marker ?-actinin. (B?D) Following ventricular resection, ?-catenin (B) and pS675-?-catenin (C) are induced at the apical cell edge of wounded myocardia. (D) Merged panel of B and C without ?-actinin. Brackets, amputation area. (E) Bar chart depicting ?-catenin and pS675-?-catenin levels following ventricular resection. Fluorescent intensities were measured at the injury border zone using Image J. ?-catenin or pS675-?-catenin levels in control hearts are normalized as 1. Data are mean � SEM from five hearts for each group. Student?s t-test, *P? |
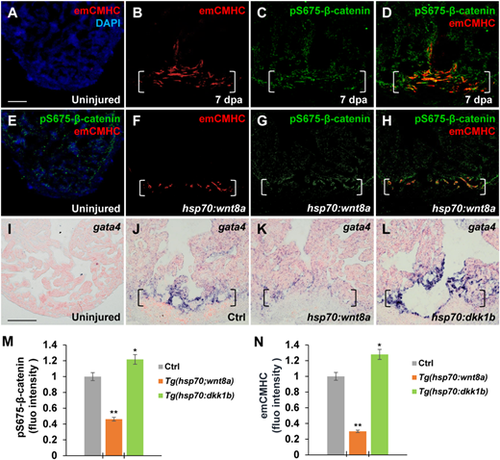
Wnt signaling inhibition associates with CM dedifferentiation during heart regeneration. (A?H) Immunofluorescence analyses showing increased emCMHC stained with N2.261 antibody and pS675-?-catenin at apical myocardial cells of the wound at 7 dpa (A?D), which was reduced by wnt8a activation in injured Tg(hsp70:wnt8a) hearts (E?H). N2.261 is not detectable in uninjured hearts (A and E) and overlaps mostly with induced pS675-?-catenin (D). (D and H) Merged panels of B and C and F and G, respectively. (I?L) ISH analyses displaying gata4 expression at injured myocardial cell edges in heat-shocked Ctrl hearts (J) at 7 dpa, which was reduced in Tg(hsp:wnt8a) hearts (K) and increased in Tg(hsp:dkk1b) hearts (L) but hardly detectable in uninjured hearts (I). Brackets indicate amputation planes. Scale bar, 100 �m. (M and N) Bar charts depicting pS675-?-catenin (M) and emCMHC (N) levels in Ctrl (normalized as 1), Tg(hsp:wnt8a), and Tg(hsp:dkk1b) hearts. Fluorescent intensities were measured at the injury border zone using Image J. Data are mean � SEM from five hearts for each group. Student?s t-test, *P? |

Inhibiting Pak2 activity using dominant-negative mutation or chemical inhibitor reduces pS675-?-catenin at wound edges in the regenerating heart. (A?D) Immunostaining and ISH analyses displaying increased Pak2 and pak2a expression, respectively, at wounded myocardial cell edge in injured hearts at 3 dpa (B and D) compared to uninjured heart (A and C). Scale bar, 100 �m. (E) qPCR analysis for expression levels of pak1, pak2a, and pak2b in uninjured and resected WT hearts at 3 or 7 dpa. ?-actin expression was used for normalization. Data are mean � SEM from three biological replicates and three technical replicates. Student?s t-test, **P? |
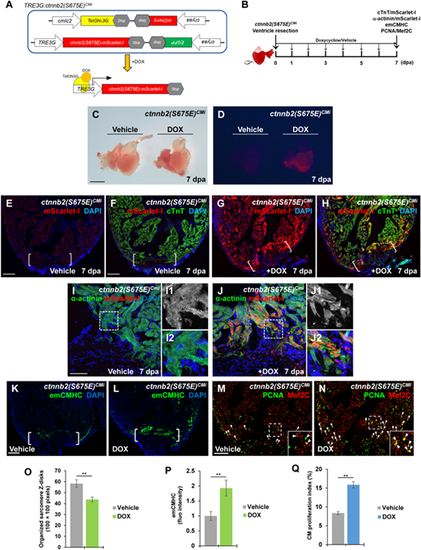
Induction of phospho-mimetic ?-catenin (S675E) in adult CMs enhances sarcomere disassembly and CM dedifferentiation. (A) Schematic diagram of double transgenes of TRE3G:ctnnb2(S675E)CMi. DOX treatment allows binding of TetON-3G to the TRE3G promoter, enabling the tissue-specific transcription of ctnnb2(S675E) in CMs. (B) Experimental strategy to induce myocardial ctnnb2(S675E) overexpression during the course of heart regeneration. Ctnnb2(S675E) induction (mScarlet-I/cTnT), sarcomere disassembly (?-actinin/mScarlet-1), CM dedifferentiation (emCMHC), and proliferation (PCNA/Mef2C) were examined at 7 dpa in vehicle-treated and TOX-treated TRE3G:ctnnb2(S675E)CMi animals. (C and D) Brightfield (C) or red fluorescence (D) images of whole-mount hearts. mScarlet-I signal was only detected in myocardium of DOX-treated hearts. Scale bar, 500 �m. (E?H) Representative confocal fluorescence images of cardiac sections immunostained for cTnT (green) and mScarlet-I (red). Scale bar, 100 �m. (I, J, and O) Myocardial wound edge regions in heart sections were co-stained for ?-actinin (green) and mScarlet-I (red). Scale bar, 50 �m. (I1, I2, J1, and J2) Magnified panels show high-magnification images of the boxed regions in I and J. (O) Quantification of organized sarcomere Z-disks in ?-actinin-marked CMs (100?�?100 pixels). (K?N, P, and Q) Confocal image analyses of emCMHC expression (K and L) and PCNA+Mef2C+ cells (arrowheads, M and N). Brackets indicate amputation planes. Insets show high-magnification images of PCNA+Mef2C+ cells in boxed regions. (P) Fluorescent intensities depicting emCMHC levels were measured at the injury border zone using Image J. emCMHC levels in vehicle-treated hearts are normalized as 1. (Q) PCNA-labeled CM proliferation indices. Scale bar, 100 �m. For bar chart analyses in O?Q, data are mean � SEM from five hearts for each group. Student?s t-test, **P? |

Inhibition of Pak2 activity impairs CM dedifferentiation and proliferation. (A) Schematic of heat shock experiments and FRAX597 treatment for PCNA/Mef2C analyses. Heat shock: 37�C for 2 h daily from 4 to 6 dpa for PCNA/Mef2C assay or over the time period from 4 to 30 dpa for AFOG analysis; treatment: 1 �M FRAX597 or 0.1% DMSO from 4 to 6 dpa. (B?D) Confocal image analyses displaying PCNA+Mef2C+ cells (arrowheads, B and C) and PCNA-labeled CM proliferation index (D) in Ctrl and Tg(hsp:dnpak2a) hearts at 7 dpa. Insets indicate high-magnification images in dash-lined areas. Data are mean � SEM from five hearts for each group. Student?s t-test, **P? |