FIGURE SUMMARY
Title

Leucine-rich repeat containing 8A contributes to the expansion of brain ventricles in zebrafish embryos

Authors
Tseng, Y.T., Ko, C.L., Chang, C.T., Lee, Y.H., Huang Fu, W.C., Liu, I.H.
Source
Full text @ Biol. Open

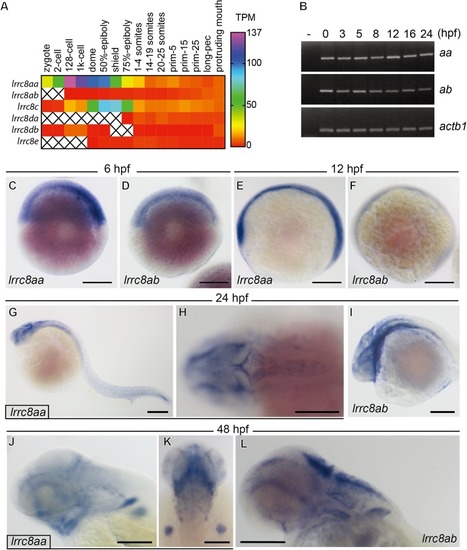
The expression profiles of zebrafish lrrc8aa and lrrc8ab. (A) The expression levels of lrrc8 family during zebrafish embryogenesis in transcripts per million (TPM) were obtained from an Expression Atlas. Lrrc8aa is much more abundant than lrrc8ab in the first 24 h of development. While lrrc8c is the most abundant family member during gastrulation; the expression levels are comparable after 24 hpf (prim-5). (B) The sequencing result did not detect lrrc8ab in zygotes and at the two-cell stage, but RT-PCR with β-actin (actb1) as the loading control showed that both lrrc8a genes are maternal messages and can be detected at all developmental stages through to 72 hpf. (C–L) Whole-mount in situ hybridization of lrrc8aa (C,E,G,H,J,K) and lrrc8ab (D,F,I,L) showed that both genes are ubiquitously presented in the zebrafish embryo at 6 (C,D) and 12 (E,F) hpf. In 24 hpf embryos (G–I), both genes could be clearly detected at the ventricular layer of the brain as well as the cardiogenic region. In 48 hpf embryos (J–L), both genes could be detected at brain ventricles, retina, otic vesicles and pectoral fin buds. Scale bars: 200 µm.

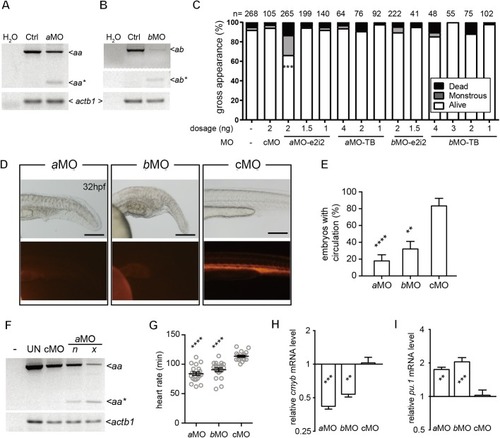
Reduction of either one of the lrrc8a paralogs resulted in identical abnormalities in the circulatory system. (A,B) RT-PCR showed that the splicing of both lrrc8aa (A) and lrrc8ab (B) can be perturbed by the respective e2i2-MOs and result in a shorter transcript (aa* in A; ab* in B). Sequencing of the PCR products indicated that exon 2 of both genes was missing. (C) Injection of 2 ng lrrc8aa-MO e2i2 led to significantly increased embryonic death and severe malformations. The sample size (n) of each group is indicated on top of the histogram. (D) Knockdown of either lrrc8aa (lrrc8aa-MO e2i2) or lrrc8ab (lrrc8ab-MO e2i2) resulted in accumulation of posterior blood islands and impaired the expansion of circulation to this region at 32 hpf. Scale bars: 200 µm. (E) The ratios of embryos with blood circulation were reduced in lrrc8aa-MO e2i2 and lrrc8ab-MO e2i2 morphants. (F) Correlation between gene knockdown efficacy (lrrc8aa-MO e2i2) and phenotypically normal (n) or not (x) was demonstrated with RT-PCR. -, no sample control; UN, untreated control. (G) Heart rates in both lrrc8aa-MO e2i2 and lrrc8ab-MO e2i2 morphants were significantly lower compared to the control morphants at 32 hpf. (H,I) At 32 hpf, quantitative RT-PCR showed that both the hematopoietic stem cell marker, cmyb, and the myeloid cell marker, pu.1, were significantly altered in both aMO and bMO morphants when compared to control morphants. aMO, lrrc8aa-MO e2i2; bMO, lrrc8ab-MO e2i2; cMO, control MO. **P<0.01; ***P<0.001; ****P<0.0001.

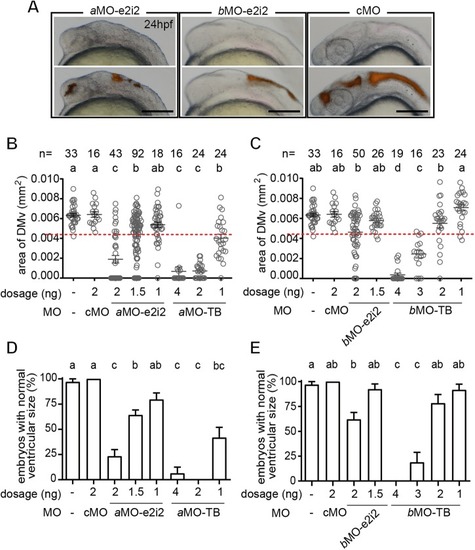
Knockdown of either zebrafish lrrc8a paralog perturbed the inflation of the brain ventricle. (A) The inflation of the brain ventricle was impaired in lrrc8a morphants. Scale bars: 200 µm. (B,C) The DMv area size was significantly reduced in lrrc8aa-MO e2i2 (aMO) and lrrc8ab-MO e2i2 (bMO) morphants compared to untreated embryos and control morphants (cMO). The sample size (n) of each group is indicated on top of the histogram. (D,E) The mean value minus two standard deviations of the untreated embryos was defined as the lower normal boundary (4.3507, red dotted line in B,C). Both lrrc8aa-MO e2i2 and lrrc8ab-MO e2i2 resulted in significantly lower normal rate compared to the untreated embryos and control morphants. Different letters on top of the histograms represent different statistical groups (P<0.05).

ZFIN is incorporating published figure images and captions as part of an ongoing project. Figures from some publications have not yet been curated, or are not available for display because of copyright restrictions.

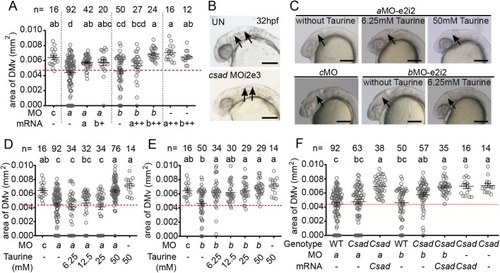
Lrrc8aa and lrrc8ab play redundant roles in facilitating the inflation of the brain ventricle. (A) The smaller DMv phenotype in lrrc8aa-MO e2i2 or lrrc8ab-MO e2i2 morphants can be rescued by overexpression of either of the lrrc8a paralog mRNA. (B) The csad-MO i2e3 morphants show a smaller brain ventricle phenotype compared to the untreated embryo at 32 hpf. The arrows indicate the brain ventricle. Scale bars: 200 µm. (C–E) The smaller DMv phenotype in lrrc8aa-MO e2i2 or lrrc8ab-MO e2i2 morphants can be rescued by culture in embryo medium supplement with taurine. The DMv area size was increased in morphant culture with taurine (C). The images are representative median values of the DMv area of each group. Arrows indicate DMv area. Scale bars: 200 µm. The lrrc8aa-MO e2i2 (D) or lrrc8ab-MO e2i2 (E) morphants were cultured in embryo medium supplement with different amounts of taurine. The smaller DMv phenotype of lrrc8aa-MO e2i2 or lrrc8ab-MO e2i2 morphants could be rescued by supplementation of 50 mM or 6.25 mM taurine in embryo medium, respectively. (F) The lrrc8a MOs were injected into the csad transgenic embryos. The smaller DMv phenotypes were partially rescued in the csad transgenic background compared to the wild-type background. Overexpression of csad mRNA into csad transgenic embryo could fully rescued the smaller DMv phenotype. Different letters on top of the histograms represent different statistical groups (P<0.05). The lower normal boundary is shown as a red dotted line. The sample size (n) of each group is indicated on top of the histogram. cMO, control MO; aMO, lrrc8aa-MO e2i2; bMO, lrrc8ab-MO e2i2; mRNA-a, lrrc8aa-IRES-eGFP mRNA 100 pg; mRNA-a++, lrrc8aa-IRES-eGFP mRNA 200 pg; mRNA-b+, lrrc8ab-IRES-eGFP mRNA 150 pg; mRNA-b++, lrrc8ab-IRES-eGFP mRNA 200 pg; untreated embryo, UN; WT, wild-type; mRNA-Csad, Csad-IRES-eGFP mRNA 150 pg.

Acknowledgments
This image is the copyrighted work of the attributed author or publisher, and ZFIN has permission only to display this image to its users. Additional permissions should be obtained from the applicable author or publisher of the image. Full text @ Biol. Open