IMAGE

Fig. 4.

ID
ZDB-IMAGE-200205-31
Source
Figures for Tseng et al., 2020
Image
Figure Caption

Fig. 4.

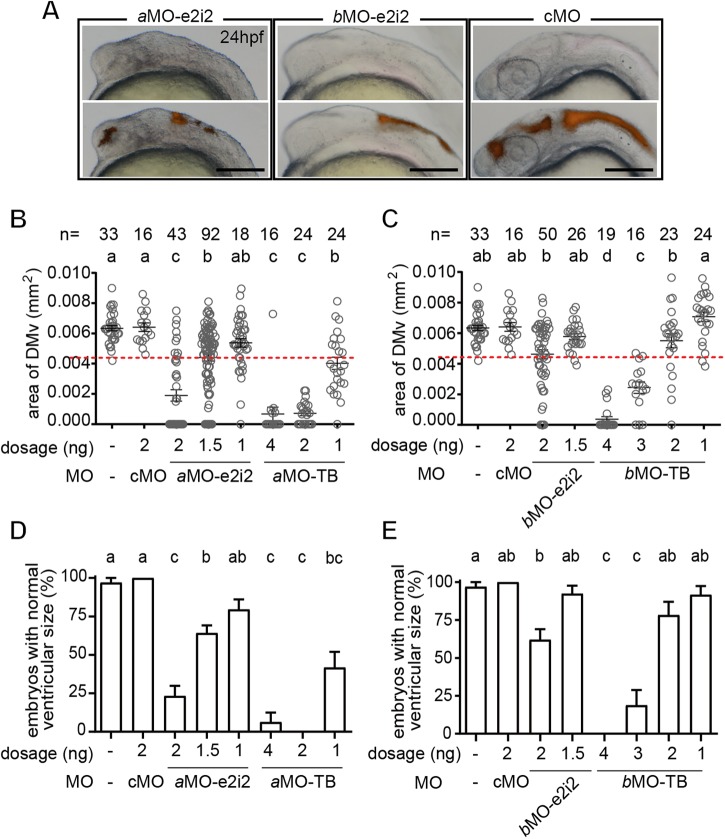
Knockdown of either zebrafish lrrc8a paralog perturbed the inflation of the brain ventricle. (A) The inflation of the brain ventricle was impaired in lrrc8a morphants. Scale bars: 200 µm. (B,C) The DMv area size was significantly reduced in lrrc8aa-MO e2i2 (aMO) and lrrc8ab-MO e2i2 (bMO) morphants compared to untreated embryos and control morphants (cMO). The sample size (n) of each group is indicated on top of the histogram. (D,E) The mean value minus two standard deviations of the untreated embryos was defined as the lower normal boundary (4.3507, red dotted line in B,C). Both lrrc8aa-MO e2i2 and lrrc8ab-MO e2i2 resulted in significantly lower normal rate compared to the untreated embryos and control morphants. Different letters on top of the histograms represent different statistical groups (P<0.05).

Figure Data
Acknowledgments
This image is the copyrighted work of the attributed author or publisher, and ZFIN has permission only to display this image to its users. Additional permissions should be obtained from the applicable author or publisher of the image. Full text @ Biol. Open