IMAGE

Fig. 3.

ID
ZDB-IMAGE-200205-30
Genes
Source
Figures for Tseng et al., 2020
Image
Figure Caption

Fig. 3.

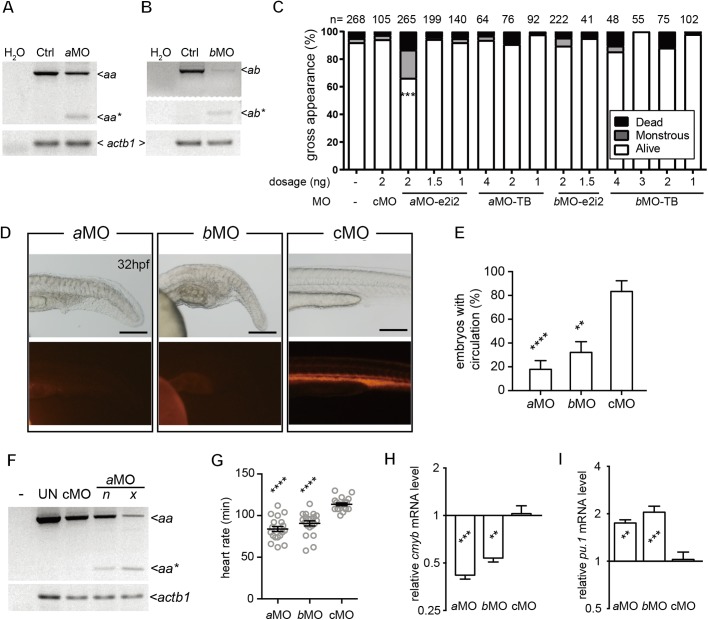
Reduction of either one of the lrrc8a paralogs resulted in identical abnormalities in the circulatory system. (A,B) RT-PCR showed that the splicing of both lrrc8aa (A) and lrrc8ab (B) can be perturbed by the respective e2i2-MOs and result in a shorter transcript (aa* in A; ab* in B). Sequencing of the PCR products indicated that exon 2 of both genes was missing. (C) Injection of 2 ng lrrc8aa-MO e2i2 led to significantly increased embryonic death and severe malformations. The sample size (n) of each group is indicated on top of the histogram. (D) Knockdown of either lrrc8aa (lrrc8aa-MO e2i2) or lrrc8ab (lrrc8ab-MO e2i2) resulted in accumulation of posterior blood islands and impaired the expansion of circulation to this region at 32 hpf. Scale bars: 200 µm. (E) The ratios of embryos with blood circulation were reduced in lrrc8aa-MO e2i2 and lrrc8ab-MO e2i2 morphants. (F) Correlation between gene knockdown efficacy (lrrc8aa-MO e2i2) and phenotypically normal (n) or not (x) was demonstrated with RT-PCR. -, no sample control; UN, untreated control. (G) Heart rates in both lrrc8aa-MO e2i2 and lrrc8ab-MO e2i2 morphants were significantly lower compared to the control morphants at 32 hpf. (H,I) At 32 hpf, quantitative RT-PCR showed that both the hematopoietic stem cell marker, cmyb, and the myeloid cell marker, pu.1, were significantly altered in both aMO and bMO morphants when compared to control morphants. aMO, lrrc8aa-MO e2i2; bMO, lrrc8ab-MO e2i2; cMO, control MO. **P<0.01; ***P<0.001; ****P<0.0001.

Figure Data
Acknowledgments
This image is the copyrighted work of the attributed author or publisher, and ZFIN has permission only to display this image to its users. Additional permissions should be obtained from the applicable author or publisher of the image. Full text @ Biol. Open