
- Title
-
Functional Regeneration of the Sensory Root via Axonal Invasion
- Authors
- Nichols, E.L., Smith, C.J.
- Source
- Full text @ Cell Rep.
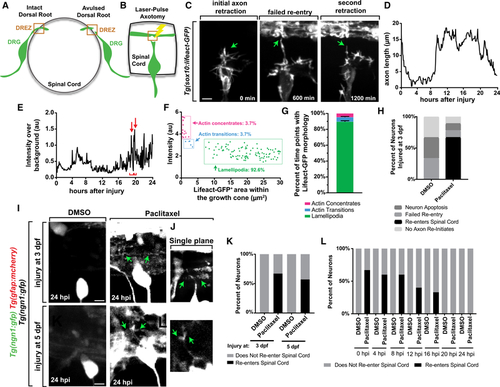
(A) Cross-section diagram of an intact and avulsed dorsal root. (B) Diagram of experimental model. At 3 dpf, a dorsal root is axotomized and time lapse imaged. (C) Z-projection time-lapse images of an avulsed DRG in a (D) Representative graph of axon length following injury. (E) Representative quantification of Lifeact-GFP intensity at the growth cone throughout regeneration. Red arrows represent actin structures, and brackets represent the duration of Lifeact peaks. (F) Representative scatterplot of the growth cone area and average Lifeact-GFP intensity during regeneration. Each time point is represented by a point. (G) Percentage of time points for which the regenerating growth cone displayed each actin organization. n = 5 DRG. (H) Outcomes of regeneration in 3 dpf injuries. n = 6 DRG per treatment. (I and J) Z-projection (I) and single-plane (J) images of (K) Outcomes of DRG injured at 3 or 5 dpf. n = 6 at 3 dpf, 7 at 5 dpf. (L) Outcomes of avulsed DRG treated with DMSO or Taxol at varying times after injury. n = 5 per treatment for 0–8 hpi, 6 per treatment for 12–24 hpi. Scale bar, 10 μm. |
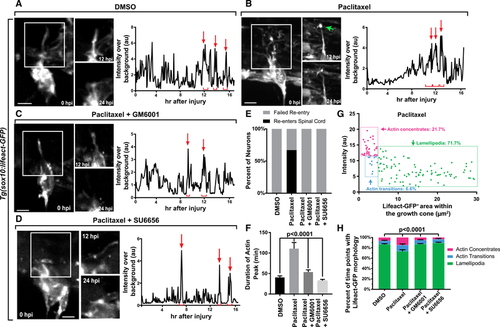
(A–D) Z-projection time-lapse images of avulsed DRG in (E) Graph of spinal re-entry in axons treated with DMSO, Taxol, Taxol+GM6001, and Taxol+SU6656. (F) Duration of actin concentrates in DMSO axons (n = 7), Taxol axons (n = 6), Taxol+GM6001 axons (n = 6), and Taxol+SU6656 axons (n = 4). (G) Representative scatterplot of growth cone area and average Lifeact-GFP intensity during regeneration in an axon treated with Taxol. Each time point is represented by a point. (H) Percentage of time points for which the regenerating growth cone displayed each actin organization. Tukey’s HSD was used in (D) and two-way ANOVA was used in (H). Scale bar, 10 mm. |
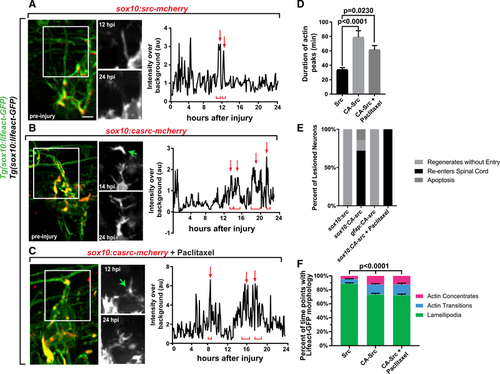
(A–C) Z-projection time-lapse images of avulsed DRG in (D) Actin concentrate duration in Src DRG (n = 6), CA-Src DRG (n = 6), and CA-Src+Taxol DRG (n = 5). (E) Regeneration outcomes in DRG expressing (F) Percentage of time points the regenerating growth cone navigated using each actin organization. Tukey’s HSD was used in (D) and two-way ANOVA was used in (F). Scale bar, 10 μm. |
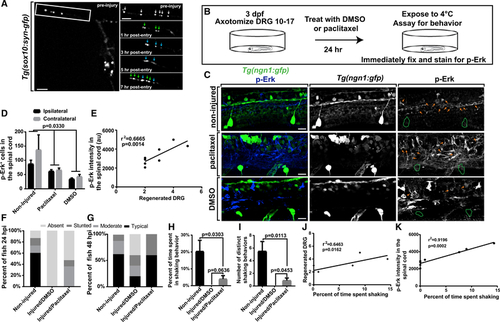
(A) Z-projection time-lapse images of a (B) Diagram of circuit and behavioral analysis. (C) Z-projection images of (D) Number of pErk+ cells in the spinal cord on ipsilateral and contralateral sides of injury (n = 8 animals per treatment). (E) Taxol-treated animals show a positive correlation between regenerated DRG and pErk intensity in the spinal cord (n = 8 animals). (F and G) Behavior at 24 hpi (F) and 48 hpi (G) in animals without injuries, avulsions with DMSO, and avulsions with Taxol (n = 8 at 24 hpi, 5 at 48 hpi). (H and I) Percentage of time shaking (H) and number of shaking behaviors (I) in animals without injuries, avulsions, and DMSO treatment and without avulsions and Taxol treatment 24 hpi (n = 8 animals per treatment). (J and K) Taxol-treated animals show a positive correlation between percentage of time shaking and regenerated DRG (J) and between percentage of time shaking and pErk spinal intensity (K) (n = 8 animals). Two-way ANOVA was used in (D); linear regression was used in (E), (J), and (K); and Tukey’s HSD was used in (H) and (I). Scale bar, 10 μm. |