
|
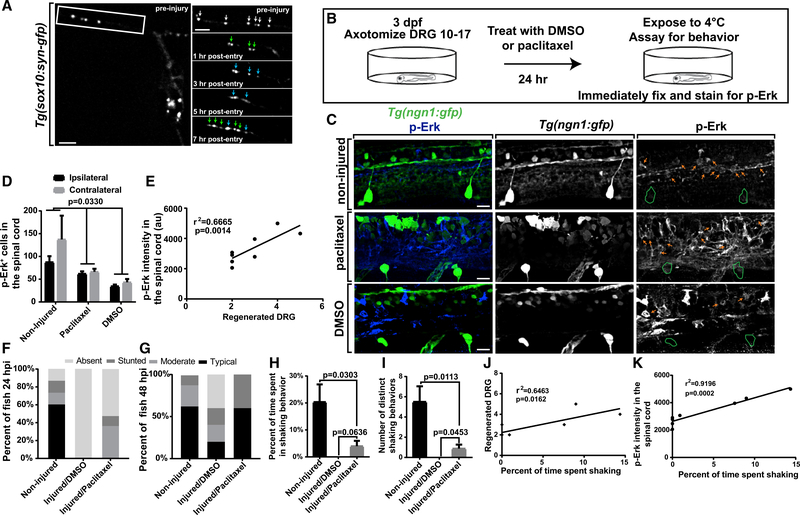
Figure 4.
(A) Z-projection time-lapse images of a
(B) Diagram of circuit and behavioral analysis.
(C) Z-projection images of
(D) Number of pErk+ cells in the spinal cord on ipsilateral and contralateral sides of injury (n = 8 animals per treatment).
(E) Taxol-treated animals show a positive correlation between regenerated DRG and pErk intensity in the spinal cord (n = 8 animals).
(F and G) Behavior at 24 hpi (F) and 48 hpi (G) in animals without injuries, avulsions with DMSO, and avulsions with Taxol (n = 8 at 24 hpi, 5 at 48 hpi). (H and I) Percentage of time shaking (H) and number of shaking behaviors (I) in animals without injuries, avulsions, and DMSO treatment and without avulsions and Taxol treatment 24 hpi (n = 8 animals per treatment).
(J and K) Taxol-treated animals show a positive correlation between percentage of time shaking and regenerated DRG (J) and between percentage of time shaking and pErk spinal intensity (K) (n = 8 animals).
Two-way ANOVA was used in (D); linear regression was used in (E), (J), and (K); and Tukey’s HSD was used in (H) and (I). Scale bar, 10 μm.