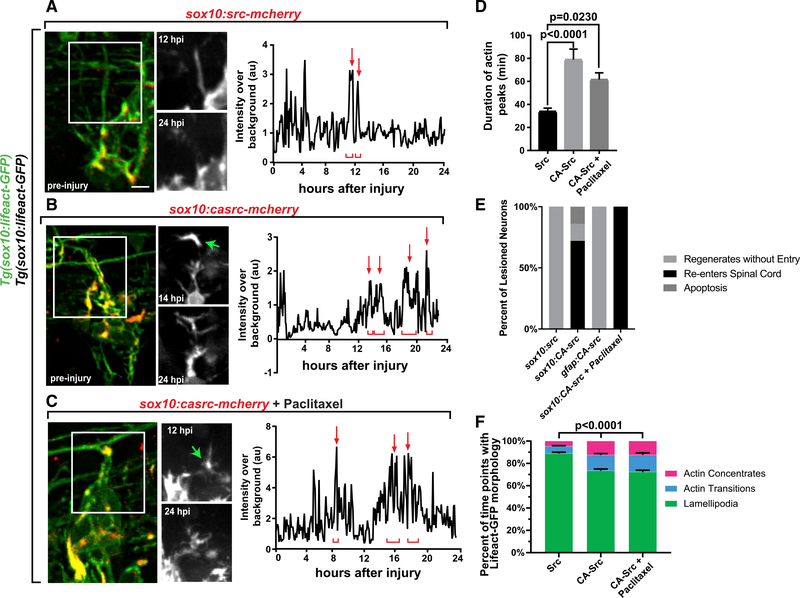
IMAGE

Figure 3.

ID
ZDB-IMAGE-200205-26
Source
Figures for Nichols et al., 2020
Image
Figure Caption

Figure 3. Induction of Invasion Components in DRG Neurons Promotes Regeneration.

(A–C) Z-projection time-lapse images of avulsed DRG in Tg(sox10:gal4); Tg(uas:lifeact-gfp) animals expressing uas:src-mcherry (A), uas:CA-src-mcherry (B), or uas:CA-src-mcherry and treated with Taxol (C). Graphs show Lifeact-GFP intensity tracings throughout regeneration. The green arrow denotes a stable invasive structure. Red arrows and brackets represent peaks of Lifeact-GFP.

(D) Actin concentrate duration in Src DRG (n = 6), CA-Src DRG (n = 6), and CA-Src+Taxol DRG (n = 5).

(E) Regeneration outcomes in DRG expressing sox10:Src, sox10:CA-Src, or sox10:CA-Src+Taxol or radial glial expressing gfap:CA-Src.

(F) Percentage of time points the regenerating growth cone navigated using each actin organization.

Tukey’s HSD was used in (D) and two-way ANOVA was used in (F). Scale bar, 10 μm.

Acknowledgments
This image is the copyrighted work of the attributed author or publisher, and ZFIN has permission only to display this image to its users. Additional permissions should be obtained from the applicable author or publisher of the image. Full text @ Cell Rep.