
|
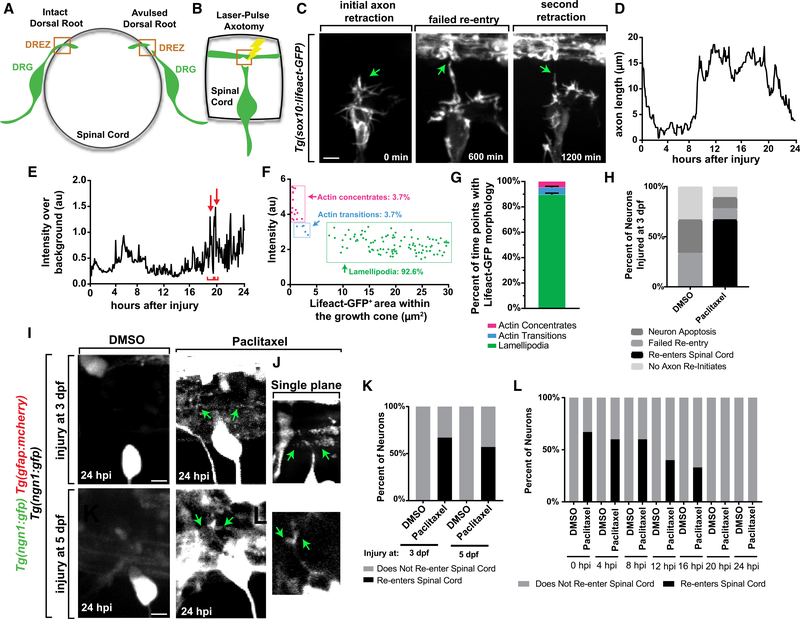
Figure 1.
(A) Cross-section diagram of an intact and avulsed dorsal root.
(B) Diagram of experimental model. At 3 dpf, a dorsal root is axotomized and time lapse imaged.
(C) Z-projection time-lapse images of an avulsed DRG in a
(D) Representative graph of axon length following injury.
(E) Representative quantification of Lifeact-GFP intensity at the growth cone throughout regeneration. Red arrows represent actin structures, and brackets represent the duration of Lifeact peaks.
(F) Representative scatterplot of the growth cone area and average Lifeact-GFP intensity during regeneration. Each time point is represented by a point.
(G) Percentage of time points for which the regenerating growth cone displayed each actin organization. n = 5 DRG.
(H) Outcomes of regeneration in 3 dpf injuries. n = 6 DRG per treatment.
(I and J) Z-projection (I) and single-plane (J) images of
(K) Outcomes of DRG injured at 3 or 5 dpf. n = 6 at 3 dpf, 7 at 5 dpf.
(L) Outcomes of avulsed DRG treated with DMSO or Taxol at varying times after injury. n = 5 per treatment for 0–8 hpi, 6 per treatment for 12–24 hpi.
Scale bar, 10 μm.