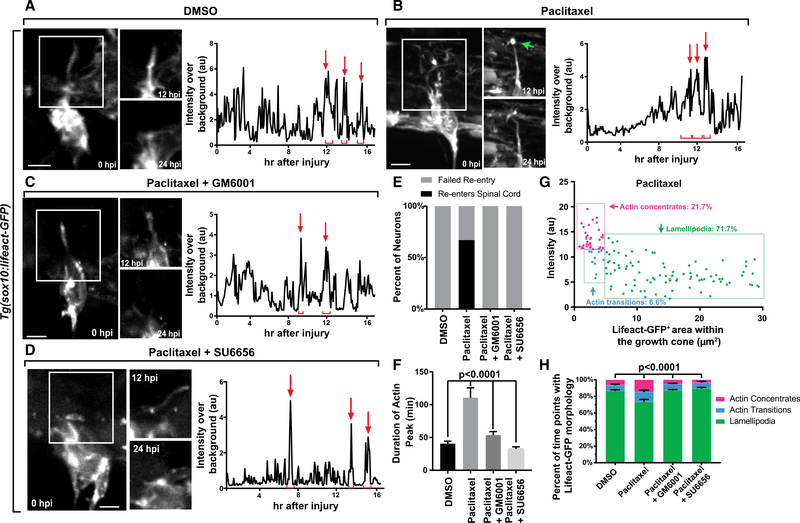
IMAGE

Figure 2.

ID
ZDB-IMAGE-200205-25
Source
Figures for Nichols et al., 2020
Image
Figure Caption

Figure 2. Taxol Induces Actin-Rich Invasion Components during Spinal Re-entry.

(A–D) Z-projection time-lapse images of avulsed DRG in Tg(sox10:gal4); Tg(uas:lifeact-gfp) animals treated with DMSO (A), Taxol (B), Taxol+GM6001 (C), and Taxol+SU6656 (D). Graphs show Lifeact-GFP intensity tracings during regeneration. White boxes denote insets of the growing axon and growth cone regions. The green arrow denotes a stable invasive structure. Red arrows and brackets represent peaks and durations of peaks of Lifeact-GFP.

(E) Graph of spinal re-entry in axons treated with DMSO, Taxol, Taxol+GM6001, and Taxol+SU6656.

(F) Duration of actin concentrates in DMSO axons (n = 7), Taxol axons (n = 6), Taxol+GM6001 axons (n = 6), and Taxol+SU6656 axons (n = 4).

(G) Representative scatterplot of growth cone area and average Lifeact-GFP intensity during regeneration in an axon treated with Taxol. Each time point is represented by a point.

(H) Percentage of time points for which the regenerating growth cone displayed each actin organization. Tukey’s HSD was used in (D) and two-way ANOVA was used in (H). Scale bar, 10 mm.

Acknowledgments
This image is the copyrighted work of the attributed author or publisher, and ZFIN has permission only to display this image to its users. Additional permissions should be obtained from the applicable author or publisher of the image. Full text @ Cell Rep.