FIGURE SUMMARY
Title

Omics-based Investigation of Diet-induced Obesity Synergized with HBx, Src, and p53 Mutation Accelerating Hepatocarcinogenesis in Zebrafish Model

Authors
Yang, W.Y., Rao, P.S., Luo, Y.C., Lin, H.K., Huang, S.H., Yang, J.M., Yuh, A.C.
Source
Full text @ Cancers

ZFIN is incorporating published figure images and captions as part of an ongoing project. Figures from some publications have not yet been curated, or are not available for display because of copyright restrictions.

Overview of omics-based investigation of hepatocarcinogenesis in zebrafish models. (A) Main procedure. (B) Experimental design of omics data in zebrafish with four genetic backgrounds: WT, HBx(p53-), Src(p53-), and HBx,Src(p53-) with diet-induced obesity. (C) qPCR of some gene markers in the four models. (D) Hematoxylin and eosin (H&E) stain images of the four zebrafish models with normal diet (NOR), overfeeding (diet-induced obesity, DIO), and high-fat diet (FAT). (E) Selected differentially expressed genes (DEGs). (F) Some enriched KEGG pathways of selected DEGs. (G) Meta-z-scores of six KEGG systems of four zebrafish models.

Expression of selected markers in various genetic background zebrafish fed with different diets. Expression of lipogenic enzymes (agpat, fasn, and pap), lipogenic factors (pparg, srebf1, and chrebp), and cell cycle/proliferation-related genes (ccne1, cdk1, and cdk2) in (AC) WT, (DF) HBx(p53-), (GI) Src(p53-), and (JL) HBx,Src(p53-) fish after eight weeks of normal diet (NOR), overfeeding (diet-induced obesity, DIO), or high-fat diet (FAT). The number of fish is 20 for each group, and the number of experimental replicates for qPCR analysis is three. Expression fold change compared to WT_NOR control. Statistical analysis of results was performed using a two-tailed Student’s t-test. Asterisks (*) represent level of significance: * p-value ≤ 0.05; ** p-value ≤ 0.01; *** p-value ≤ 0.001; **** p-value ≤ 0.0001.

Histopathological changes in various genetic background zebrafish fed with different diets. Representative H&E stain images and histopathologic change statistics of (AD) WT, (EH) HBx(p53-), (IL) Src(p53-), and (MP) HBx, Src(p53-) fish after 8 weeks of normal diet (NOR), overfeeding (diet-induced obesity, DIO), or high-fat diet (FAT) starting at 3 months of age, and scarified at 5 months. The histopathologic change consists of percentages in five states: normal, steatosis, hyperplasia, dysplasia, and hepatocellular carcinoma (HCC). The number of fish is represented as N on top of each bar. The scale bar is 50 μm.

Histopathological changes in various genetic background zebrafish fed with different diets. Representative H&E stain images and histopathologic change statistics of (AD) WT, (EH) HBx(p53-), (IL) Src(p53-), and (MP) HBx,Src(p53-) fish after 16 weeks of normal diet (NOR), overfeeding (diet-induced obesity, DIO), or high-fat diet (FAT) starting at 3 months of age, and scarified at 7 months. The histopathologic change consists of percentages in five states: normal, steatosis, hyperplasia, dysplasia, and hepatocellular carcinoma (HCC). The number of fish is represented as N on top of each bar. The scale bar is 50 μm.

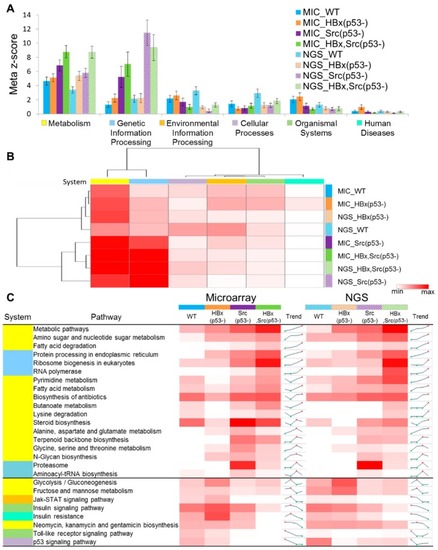
Statistics of system-level meta-z-scores and pathway z-scores for the four genetic fish models. (A) Meta-z-scores and (B) heatmap of six KEGG systems of the 30 samples with four models and three diet types in microarray and NGS. WT: blue; HBx(p53-): deep orange; Src(p53-): purple; and HBx,Src(p53-): green. MIC, microarray; NGS, next-generation sequencing. Red and white denote high and low meta-z-scores, respectively. (C) Pathway z-score distributions and trends of microarray and NGS in the four models. For KEGG system, yellow bar: metabolism; light blue bar: genetic information processing; orange bar: environmental information processing; light purple bar: cellular processes; light green bar: organismal systems; cyan blue: human diseases. Red and white denote high and low scores, respectively. For trend column, red and green dots indicate the highest and lowest z-scores, respectively. The number of fish is for microarray and NGS are listed in Table S1, there are 14 samples for microarray, 16 samples for NGS.

Precision comparison of three scoring methods for obesity and HCC. Scoring methods for selecting potential genes are maximum combined score (MCS, red), average root combined score (ARCS, orange), and fold change (FC, blue) for (A) obesity in WT fish and (B) HCC in HBx,Src(p53-) fish with overfeeding and high-fat diet. Positive sets are selected from DisGeNET database.

Validation of microarray with qPCR for the representative genes. Expression of (A,F) scd, (B,G) gck, (C,H) acat2, (D,I) pik3ca, and (E,J) aldh7a1 in WT, HBx(p53-), Src(p53-), and HBx,Src(p53-) fish after eight weeks of normal diet (NOR), overfeeding (diet-induced obesity, DIO), or high-fat diet (FAT) from (AE) microarray and (FJ) qPCR analysis. (K) Top 14 genes selected by global omics data analysis. (L) Among the 14 genes, 5 genes (red) overexpressed in WT diet-induced obesity are related to glucose and lipid metabolism. The number of fish is 20 for each group, and the number of experimental replicates for qPCR analysis is 3.

Acknowledgments
This image is the copyrighted work of the attributed author or publisher, and ZFIN has permission only to display this image to its users. Additional permissions should be obtained from the applicable author or publisher of the image. Full text @ Cancers