FIGURE

Figure 5

ID
ZDB-FIG-200129-31
Publication
Yang et al., 2019 - Omics-based Investigation of Diet-induced Obesity Synergized with HBx, Src, and p53 Mutation Accelerating Hepatocarcinogenesis in Zebrafish Model
Other Figures
All Figure Page
Back to All Figure Page
Figure 5

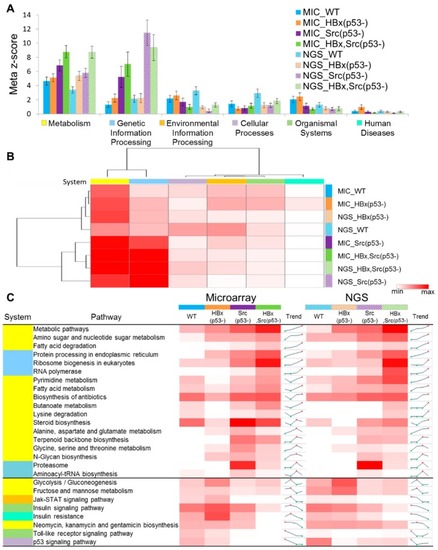
Statistics of system-level meta-z-scores and pathway z-scores for the four genetic fish models. (A) Meta-z-scores and (B) heatmap of six KEGG systems of the 30 samples with four models and three diet types in microarray and NGS. WT: blue; HBx(p53-): deep orange; Src(p53-): purple; and HBx,Src(p53-): green. MIC, microarray; NGS, next-generation sequencing. Red and white denote high and low meta-z-scores, respectively. (C) Pathway z-score distributions and trends of microarray and NGS in the four models. For KEGG system, yellow bar: metabolism; light blue bar: genetic information processing; orange bar: environmental information processing; light purple bar: cellular processes; light green bar: organismal systems; cyan blue: human diseases. Red and white denote high and low scores, respectively. For trend column, red and green dots indicate the highest and lowest z-scores, respectively. The number of fish is for microarray and NGS are listed in Table S1, there are 14 samples for microarray, 16 samples for NGS.

Expression Data

Expression Detail
Antibody Labeling
Phenotype Data

Phenotype Detail
Acknowledgments
This image is the copyrighted work of the attributed author or publisher, and ZFIN has permission only to display this image to its users. Additional permissions should be obtained from the applicable author or publisher of the image. Full text @ Cancers