- Title
-
Mapping the development of cerebellar purkinje cells in zebrafish
- Authors
- Hamling, K.R., Tobias, Z.J., Weissman, T.A.
- Source
- Full text @ Dev. Neurobiol.
|
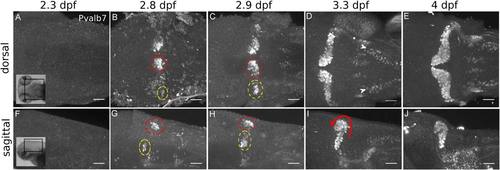
Parvalbumin7 expression reveals Purkinje cell development between 2.3 and 4 dpf. Maximum intensity projections of confocal image stacks (roughly 200 µm in depth) of Pvalb7 expression from dorsal (A?E) and sagittal (F?J) views between 2 and 4 dpf. Insets show approximate dorsal and sagittal brain region imaged (A, F). Pvalb7 expression was seen by 2.8 dpf (67 hpf) in a dorsomedial cluster (red dashed circle) and ventrolateral cluster (yellow dashed circle). These clusters became less distinct by 2.9 and 3.3 dpf (70 and 80 hpf; C, D, H, I) and appeared to merge by 4 dpf (E, J), while the Purkinje cells begin to curve forward (I, curving arrow). A population of dorsolateral hindbrain Pvalb7-expressing neurons was present by 3.3 dpf (D, white arrowheads). Scale bar 50 µm. Images taken using 20× (1.0 NA) water objective. |
|
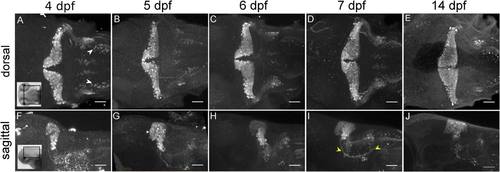
Parvalbumin7 expression reveals morphological changes in the Purkinje cell layer between 4 and 14 dpf. Maximum intensity projections of Pvalb7 expression from dorsal (A?E) and sagittal (F?I) views in 4?14 dpf larvae. Insets represent approximate dorsal and sagittal brain region imaged (A, F). The wing-shaped morphology of the Purkinje cell layer is present at all developmental time points (A?E), though it begins to wrap more anteriorly (see G?I) and Purkinje cells begin to project cerebellovestibular axons (yellow arrowheads) by 7 dpf (I). Dorsolateral hindbrain neurons are present by 4 dpf (A, white arrowheads). Scale bar 50 µm. Images taken using 20× (1.0 NA) water objective. EXPRESSION / LABELING:
|
|
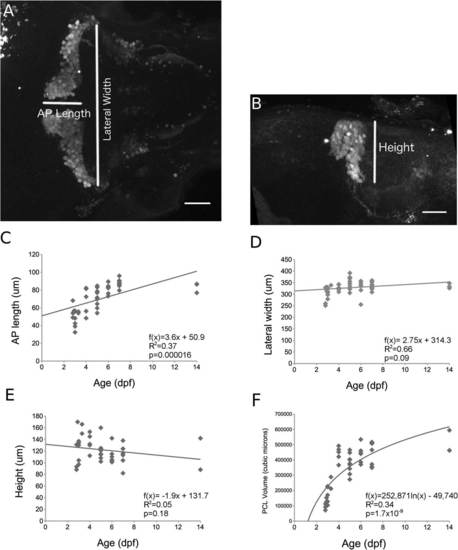
Average Purkinje cell layer anterior?posterior length and volume change during early development. Sample image shows anterior?posterior length (AP length), lateral width (A) and height (B) measurements in a 5 dpf larva. (C) Scatter plot of AP length (µm) between 2.8 and 14 dpf. AP length increased linearly with increasing age (p = 0.000016). (D) Lateral width (µm) did not significantly change between 2.8 and 14 dpf (p = 0.09). (E) Purkinje cell layer height did not significantly change with age (p = 0.18). (F) Purkinje cell layer (PCL) volume (µm3) increased logarithmically between 2.8 and 14 dpf (p = 1.7 × 10⁹). Curve estimates represent linear (C, D, E) or logarithmic regression (F). Scale bars 50 µm. Images taken using 20× (1.0 NA) water objective. Sample sizes for each time point (number of animals) are as follows: 2.8 dpf = 3; 2.9 dpf = 2; 3 dpf = 5; 3.3 dpf = 2; 4 dpf = 5; 5 dpf = 9; 6 dpf = 6; 7 dpf = 8; 14 dpf = 3. In 3E, 5 dpf = 8. In 3D, 7 dpf = 9. In 3E, 14 dpf = 2. |
|
Purkinje cell dendritic arbor develops over time. (A) Pvalb7 and VGlut1 expression in Purkinje cells at 3.3 dpf (80 hpf). Pvalb7 (A1), Vglut1 (A2) expression, and merge of channels (A3) shows that Pvalb7 is expressed in cell bodies but no visible primary dendrites, and that VGlut1 is found directly dorsal to Purkinje cell bodies and overlapping with some possible Pvalb7 expression in neuropil (white dashed region). (B1?3) By 5dpf, the immature dendrites are also overlapping with the expanded VGlut1 expression in parallel fibers. (C1?3) By 7dpf, the Purkinje cell dendrite has grown dorsally and the VGlut1 layer has expanded accordingly to remain overlapping. Inset in A2 shows rough location of sagittal plane of section (indicated by dashed line). Scale bar 10 µm. Images taken using 20× (1.0 NA) water objective, at 5× zoom. EXPRESSION / LABELING:
|
|
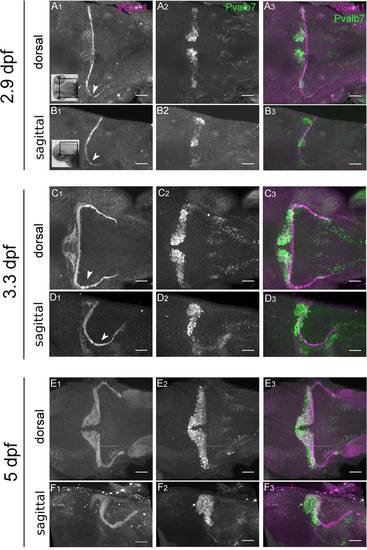
Vglut1 expression in parallel fibers moves anteriorly early in development and coincides with Purkinje cell development. (A, B) Expression at 2.9 dpf (70 hpf) of VGlut1 (A1, B1) and Pvalb7 (A2, B2), in both dorsal and sagittal views. Merge (A3, B3) shows that VGlut1 and Pvalb7 show little overlap at this early time point. Additionally, VGlut1 expression can be found in parallel fibers that project posteriorly (A1, B1; white arrowheads). (C, D) Expression at 3.3 dpf (80 hpf) of VGlut1 (C1, D1), Pvalb7 (C2, D2) and merge (C3, D3) shows that parallel fibers expand forward, beginning to overlap with Purkinje cells during this time period. There is substantial outgrowth of parallel fibers projecting posteriorly (C1, D1; white arrowheads). (E, F) Expression at 5dpf shows that by this time point VGlut1 (E1, F1) and Pvalb7 (E2, F2) are highly spatially coordinated (merge; E3, F3) and both layers have begun to curve anteriorly. Scale bar 50 µm. Images taken using 20× (1.0 NA) water objective. |


