Fig. 1
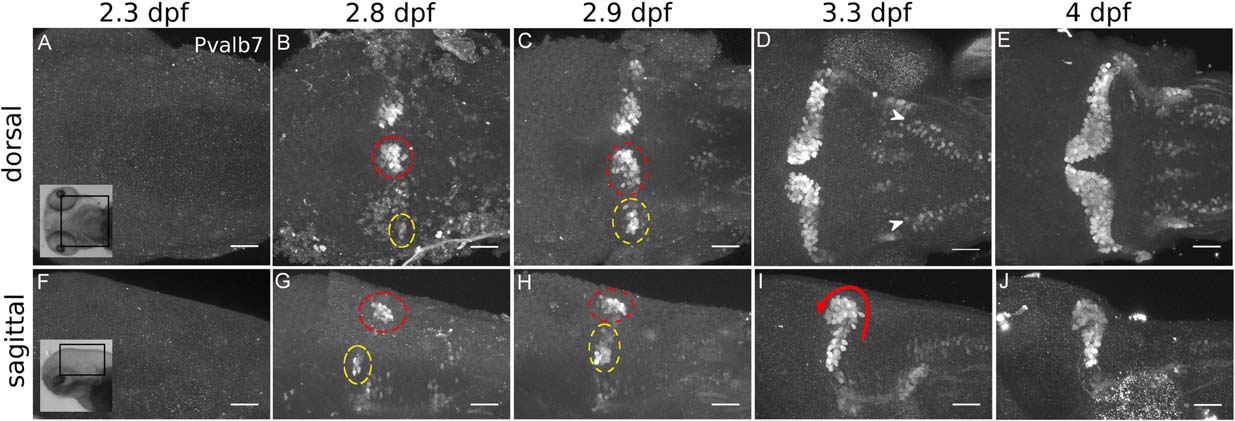
Parvalbumin7 expression reveals Purkinje cell development between 2.3 and 4 dpf. Maximum intensity projections of confocal image stacks (roughly 200 µm in depth) of Pvalb7 expression from dorsal (A?E) and sagittal (F?J) views between 2 and 4 dpf. Insets show approximate dorsal and sagittal brain region imaged (A, F). Pvalb7 expression was seen by 2.8 dpf (67 hpf) in a dorsomedial cluster (red dashed circle) and ventrolateral cluster (yellow dashed circle). These clusters became less distinct by 2.9 and 3.3 dpf (70 and 80 hpf; C, D, H, I) and appeared to merge by 4 dpf (E, J), while the Purkinje cells begin to curve forward (I, curving arrow). A population of dorsolateral hindbrain Pvalb7-expressing neurons was present by 3.3 dpf (D, white arrowheads). Scale bar 50 µm. Images taken using 20× (1.0 NA) water objective.

