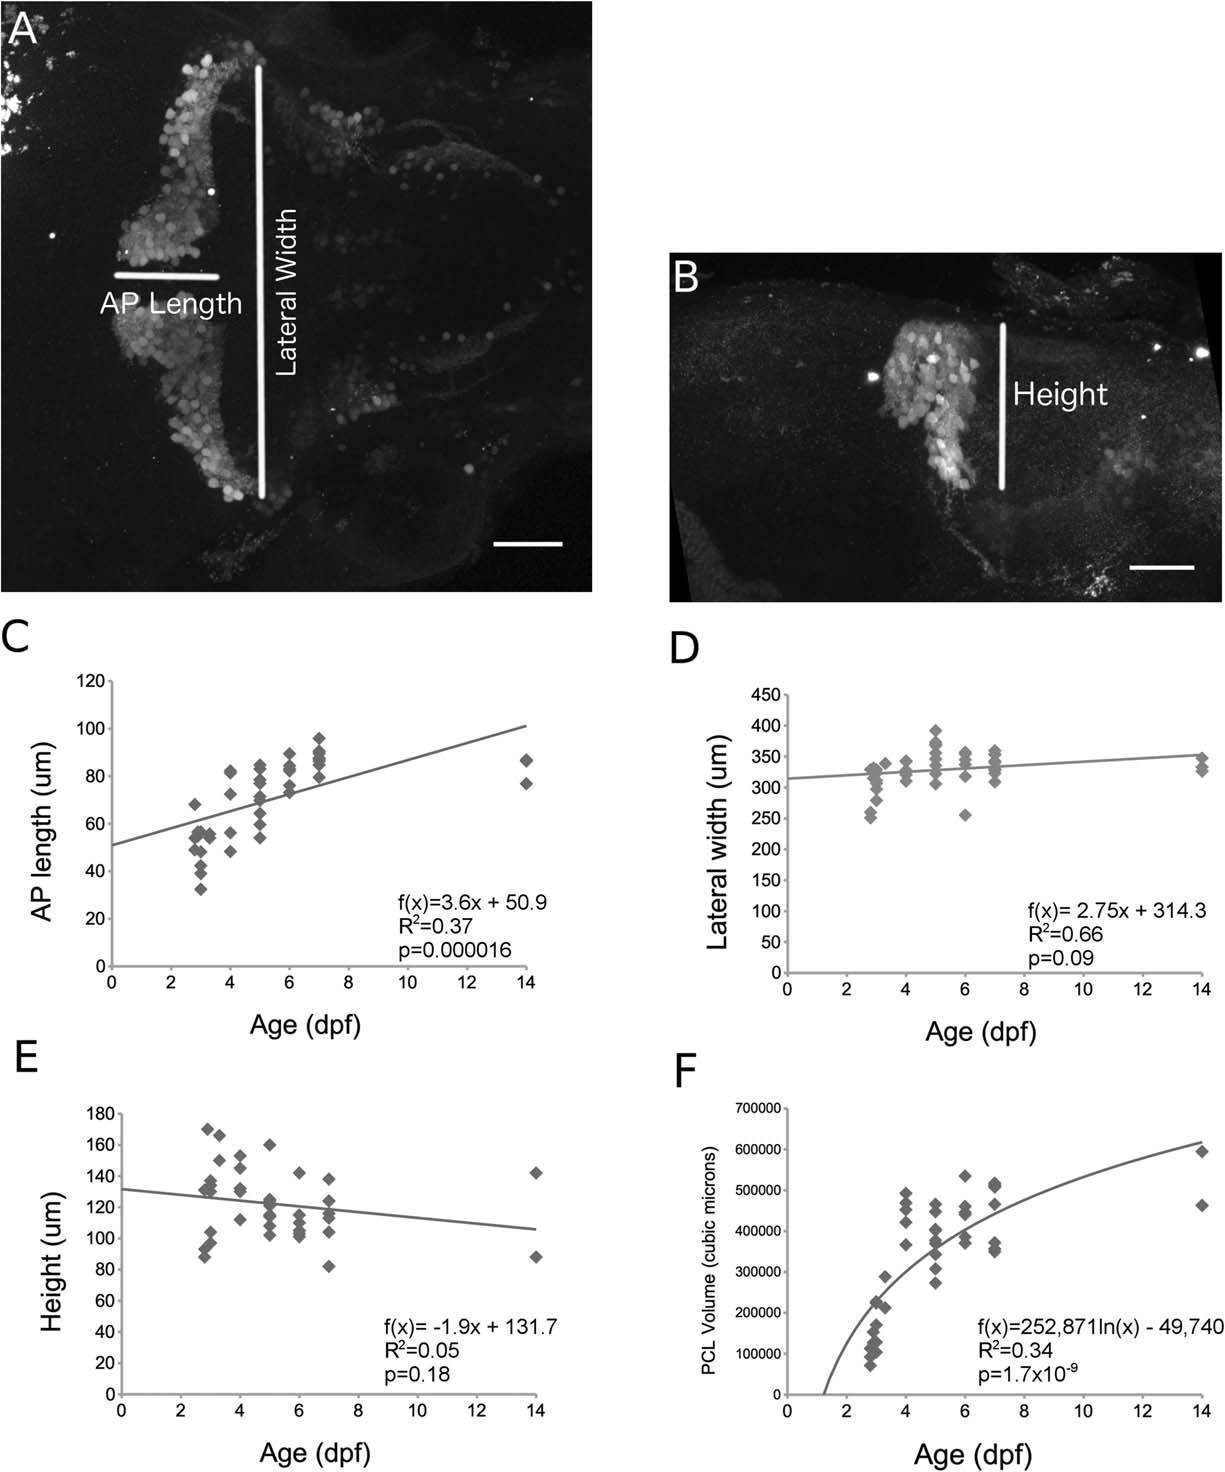
Fig. 3
Average Purkinje cell layer anterior?posterior length and volume change during early development. Sample image shows anterior?posterior length (AP length), lateral width (A) and height (B) measurements in a 5 dpf larva. (C) Scatter plot of AP length (µm) between 2.8 and 14 dpf. AP length increased linearly with increasing age (p = 0.000016). (D) Lateral width (µm) did not significantly change between 2.8 and 14 dpf (p = 0.09). (E) Purkinje cell layer height did not significantly change with age (p = 0.18). (F) Purkinje cell layer (PCL) volume (µm3) increased logarithmically between 2.8 and 14 dpf (p = 1.7 × 10⁹). Curve estimates represent linear (C, D, E) or logarithmic regression (F). Scale bars 50 µm. Images taken using 20× (1.0 NA) water objective. Sample sizes for each time point (number of animals) are as follows: 2.8 dpf = 3; 2.9 dpf = 2; 3 dpf = 5; 3.3 dpf = 2; 4 dpf = 5; 5 dpf = 9; 6 dpf = 6; 7 dpf = 8; 14 dpf = 3. In 3E, 5 dpf = 8. In 3D, 7 dpf = 9. In 3E, 14 dpf = 2.

