
- Title
-
Rho-regulated Myosin phosphatase establishes the level of protrusive activity required for cell movements during zebrafish gastrulation
- Authors
- Weiser, D.C., Row, R.H., and Kimelman, D.
- Source
- Full text @ Development
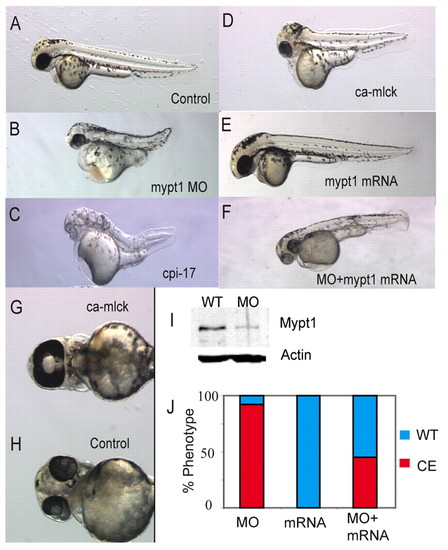
Myosin phosphatase is required for body axis elongation in zebrafish. (A-F) Dorsal views of 48 hpf zebrafish embryos injected with (A) control, (B) 1 ng mypt1 MO, (C) 200 pg cpi-17 mRNA, (D) 100 pg ca-mlck mRNA, (E) 100 pg of human MYPT1 mRNA. (F) A partially rescued embryo injected with 100 pg human MYPT1 mRNA and 1 ng mypt1 MO. (G,H) Ventral views of the head of 48 hpf zebrafish embryos showing a ca-mlck-injected embryo displaying cyclopia (G) and a control embryo (H). (I) Western blot showing endogenous Mypt1 levels in the presence and absence (WT) of 1 ng mypt1 MO. (J) Quantification of the truncated body axis phenotype in morphant and mRNA-injected embryos. The y-axis displays the percentage of embryos exhibiting a severe axis extension defect (red) or normal axis extension (blue). The x-axis displays the injected reagent. |
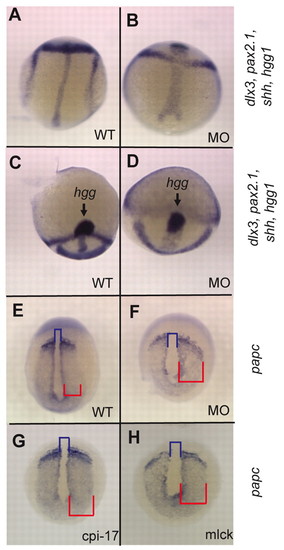
Mypt is required for morphogenetic cell movements during gastrulation. Zebrafish embryos at bud stage stained for (A-D) hgg1 (to mark the prechordal plate), shh (midline), pax2.1 (pax2a; midbrain-hindbrain boundary) and dlx3 (neural plate) or (E-H) papc (pcdh8; presomitic mesoderm). The blue bracket indicates the width of the notochord and the red bracket indicates the width of the presomitic mesoderm. |
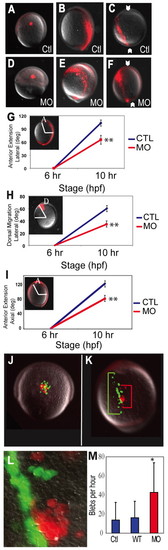
Mypt1 regulates convergence and extension. (A-F) Distribution of labeled lateral cells at shield and bud stages. The fluorescent dye was uncaged at shield stage (A,D), and examined at bud stage in lateral (B,E) and dorsal (C,F) views of control (Ctl) and mypt1 morphant (MO) zebrafish embryos. Arrowheads indicate the notochord. (G,H) Quantification of the dorsal convergence and anterior extension of lateral cells in control and morphant embryos. (G) Anterior extension is defined as the angle between the anterior-most labeled cell and the dorsal side (lateral view, anterior at top). (H) Dorsal migration is defined as the angle between the site of activation at shield stage and the site of labeled cells at bud stage (animal pole view, dorsal at top, lateral to the left). (I) Migration of the axial mesoderm is calculated by measuring the angle between the dorsal side and the head mesoderm in the laterally labeled embryos (A-F). A, anterior; D, dorsal. (J-L)WT (green) and mypt1 MO (red) cells were transplanted into WT shield-stage hosts (J, lateral view) and the host embryos were allowed to develop until bud stage (K, dorsal view 50x; L, dorsal view 400x), when the extent of migration of both WT and MO cells was determined. Green bracket indicates the total extension of WT cells and the red bracket indicates the extension of morphant cells. (M) Quantification of blebs per hour of host control cells, transplanted WT cells and transplanted MO cells. *, P<0.05; **, P<0.01. |
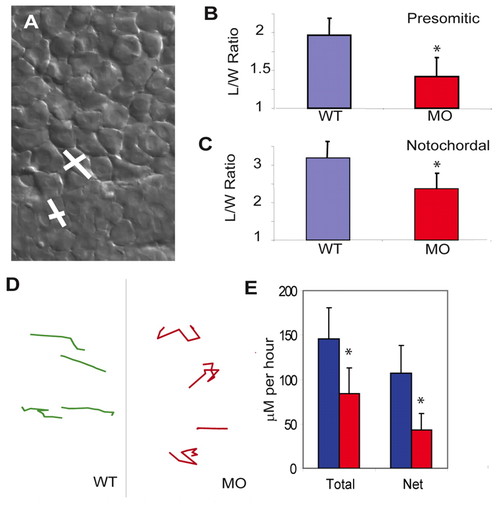
Mesodermal cell polarity and migration are controlled by Mypt1. (A-C) The cell polarity of presomitic (B) and notochordal (C) mesodermal cells was determined by calculating the length-to-width (L/W) ratio (y-axis). (A) WT cells showing the long axis length and the short axis width. Note that mypt1 morphant cells are more rounded than the WT in both the notochord and presomitic mesoderm. (D,E) The migration ability of mesodermal cells was measured by tracking individual presomitic mesoderm cells at bud stage. Representative tracks of WT and morphant cells (D) are quantified (E). The y-axis displays dorsal movement in μm per hour; both total migration and net dorsal migration are shown. Note that morphant cells are more erratic in their movement and migrate less overall. *, P<0.05. PHENOTYPE:
|
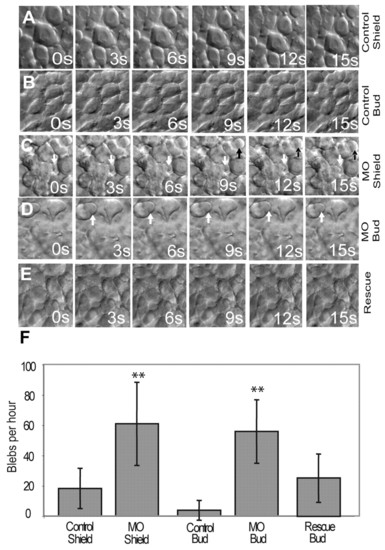
Mypt1 inhibits bleb-like protrusive activity. (A-E) Membrane protrusive activity of mesodermal cells at shield and bud stages was determined by time-lapse microscopy. Shown is the behavior of mesodermal cells in control zebrafish embryos at shield (lateral cells, A) and bud (dorsal cells, B) stages, mypt1 morphants at shield (C) and bud (D) stages, and mypt1 mRNA and MO co-injected embryos (E). White and black arrows indicate bleb-like protrusions. s, seconds. (F) Quantification of the blebbing behavior shown in A-E. The y-axis shows the number of blebs per cell per hour. Note the large increase in protrusive activity in mypt1 morphants relative to the control at both time points. **, P<0.01. |
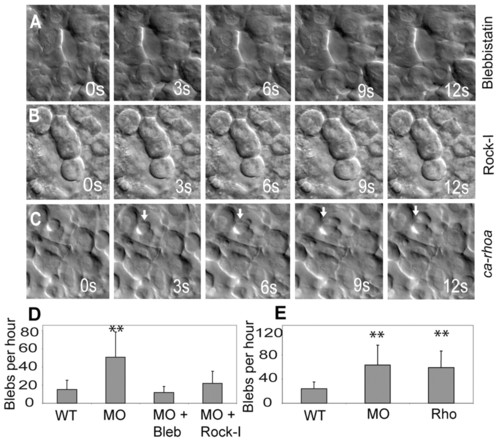
Mypt1 inhibits the Rho-Rock-Myosin pathway. (A,B) mypt1 morphant zebrafish embryos were treated with blebbistatin (A) or Rho kinase inhibitor III (B, Rock-I) and assayed for blebbing activity by time-lapse microscopy at bud stage. s, seconds. (C)ca-rhoA mRNA results in excessive blebbing of lateral mesoderm at shield stage. (D,E) Quantification of data in A and B (D) and C (E). The y-axis shows the number of blebs per cell per hour. **, P<0.01. PHENOTYPE:
|
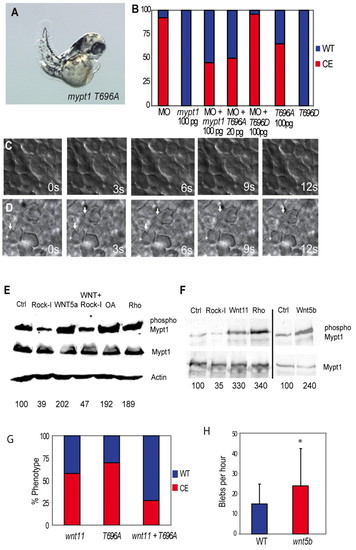
Rock and non-canonical Wnts mediate the inhibitory phosphorylation of Mypt1. (A) mypt1 T696A mRNA (100 pg) expression elicits gastrulation defects in zebrafish embryos. (B) Quantification of convergent extension (CE) defects in mypt1 T696A- and T696D-injected embryos and rescue of the MO phenotype. Red indicates a CE defect; blue indicates a normal body axis length. (C) Lack of protrusive activity of dorsal mesodermal cells in mypt1 T696A-injected embryos at bud stage. s, seconds. (D) Increased protrusive activity of dorsal mesodermal cells in wnt5b (100 pg)-injected embryos at bud stage. Arrows indicate bleb-like protrusions. (E) Western blot of HEK 293 lysates expressing myc-tagged Mypt1 treated with WNT5A-conditioned medium, or control-conditioned medium. Cells were also either co-transfected with ca-rhoA or treated with Rock inhibitor (Rock-I) or the phosphatase inhibitor okadaic acid (OA) and blotted for Mypt1, phospho-Mypt1, Mypt1 and Actin. (F) Myc-tagged Mypt1 was immunoprecipitated from zebrafish embryos and blotted for Mypt1 and phospho-Mypt1. Embryos were also injected with 10 pg ca-rhoA, 100 pg wnt11, 100 pg wnt5b mRNA or treated with Rock inhibitor. Numbers beneath the lanes in E,F indicate the percentage of phospho-Mypt1 relative to the control. (G) Quantification of the rescue of the wnt11 (100 pg) overexpression phenotype by co-expression of mypt1 T696A (100 pg) mRNA. (H) Induction of blebbing of dorsal mesodermal cells at bud stage in wnt5b (100 pg)-injected embryos. *, P<0.05. |
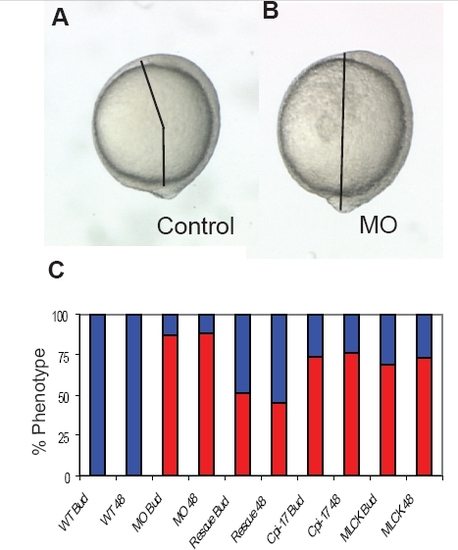
Convergent extension defects at bud stage and 48 hours. Injected embryos were scored at bud stage and again at 48 hours to determine the extent of the CE defect. At bud stage, the angle between the tailbud and head was measured. An angle greater than 90 degrees was scored as WT and less than 90 degrees as a CE phenotype. At 48 hours, short embryos with misshapen somites were scored as a CE phenotype. The angle between the head and tailbud in (A) a WT and (B) a morphant embryo. (C) Phenotype of WT (112 embryos), morphant (109 embryos), rescued embryos (121 embryos), cpi-17 (95 embryos) and ca-mlck (121 embryos) injected embryos were scored twice, once at bud stage and again at 48 hours. |