
|
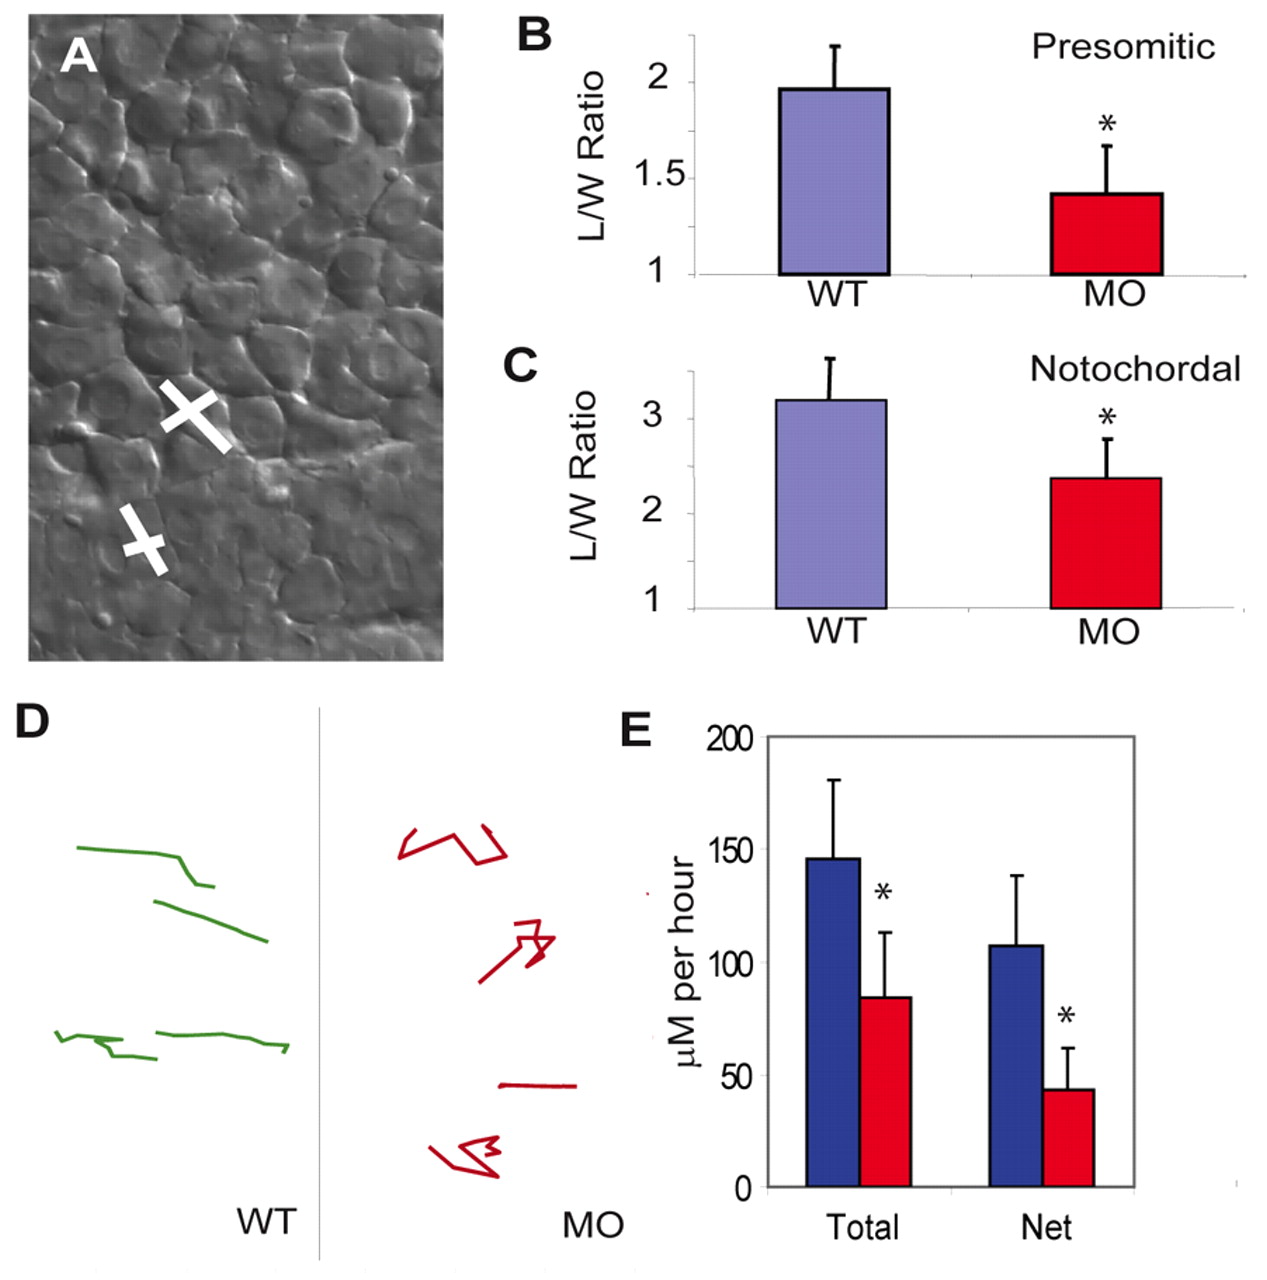
Fig. 4 Mesodermal cell polarity and migration are controlled by Mypt1. (A-C) The cell polarity of presomitic (B) and notochordal (C) mesodermal cells was determined by calculating the length-to-width (L/W) ratio (y-axis). (A) WT cells showing the long axis length and the short axis width. Note that mypt1 morphant cells are more rounded than the WT in both the notochord and presomitic mesoderm. (D,E) The migration ability of mesodermal cells was measured by tracking individual presomitic mesoderm cells at bud stage. Representative tracks of WT and morphant cells (D) are quantified (E). The y-axis displays dorsal movement in μm per hour; both total migration and net dorsal migration are shown. Note that morphant cells are more erratic in their movement and migrate less overall. *, P<0.05.