FIGURE SUMMARY
Title

The endosomal protein Appl1 mediates Akt substrate specificity and cell survival in vertebrate development

Authors
Schenck, A., Goto-Silva, L., Collinet, C., Rhinn, M., Giner, A., Habermann, B., Brand, M., and Zerial, M.
Source
Full text @ Cell

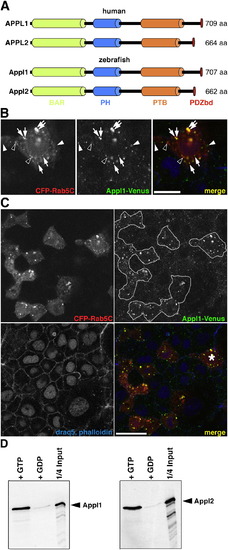
Appl Proteins, Their Localization, and Biochemical Properties Are Conserved in Zebrafish
(A) Schematic representation of human and zebrafish APPL proteins indicating functional domains and total length.
(B and C) Zebrafish embryos injected with 100 pg appl1-Venus mRNA at single-cell stage and with 50 pg CFP-Rab5C mRNA into single blastomeres at 16-cell stage, fixed, and imaged at 50% epiboly stage. Single confocal sections are shown. Draq5 and phalloidin staining highlight nuclei and cell margins in blue.
(B) A cell coexpressing fluorescently labeled Appl1 and Rab5C proteins. Many labeled structures are shared between the two proteins (yellow, in merged panel, few highlighted by arrows). White arrowheads, structures that carry only Appl1-Venus; empty arrowheads, structures labeled by Rab5C only. The scale bar represents 10 μm.
(C) Distribution of ubiquitously expressed Appl1-Venus is altered in CFP-Rab5C coexpressing cells (outlined by white line): bigger and brighter structures are observed. Asterisk indicates cell represented in (B). The scale bar represents 20 μm.
(D) GST pull-down assays. Recombinant GST-Rab5C protein, loaded with either GTPγS (+GTP) or GDP (+GDP) nucleotides. In vitro translated Appl1 and Appl2 proteins bind specifically to Rab5C+GTP.

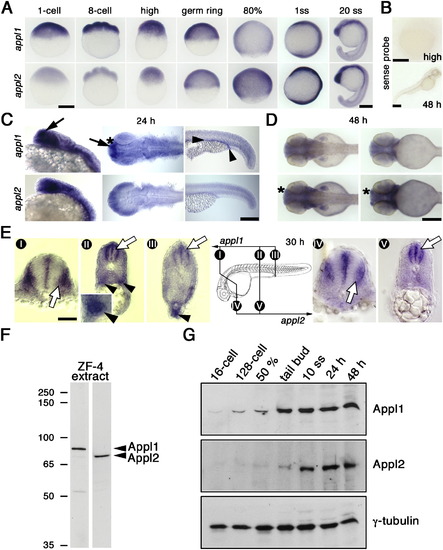
appl Developmental Expression Profiles
(A) appl1 and 2 mRNA patterns during early embryogenesis, revealed by antisense probes. Lateral views. %, % epiboly; ss, somites. Both genes are ubiquitously expressed.
(B) Simultaneous ISH with an appl1 sense probe. No unspecific background staining was observed.
(C) appl1 and 2 mRNA expression at 24 hr of zebrafish development. Left panels, heads in lateral view; mid panels, heads from top; right panels, tails in lateral view. High expression of appl1 is observed in telencephalon (arrows), olfactory pits (asterisks), and pronephros (arrowheads).
(D) appl1 and 2 mRNA expression at 48 hr of zebrafish development. Left panels, dorsal views; right panels, ventral views on the zebrafish trunk. appl2 mRNA is enriched in the olfactory placode (asterisks).
(E) Sections through appl1 (panels I–III) or appl2 (panels IV and V) whole-mount ISH of 30 hr zebrafish. Positions of sections are indicated in the scheme. Empty arrows, high expression of appl1 and appl2 in specific zones of the hindbrain (I and IV) and neural tube (II, III, and V). Arrowheads, appl1 in the pronephric duct.
(A–E) appl1 and 2 whole-mount ISH (in violet) on zebrafish embryos of indicated developmental stages. The scale bars in (A) and (B) represent 250 μm; in (C) and (D), 200 μm; and in (E), 50 μm.
(F) Antibodies to Appl1 and Appl2 recognize single bands of 80 and 75 kD in immunoblots on ZF4 extract.
(G) Western blot analysis of staged zebrafish embryos using anti-Appl antibodies. Anti-γ-tubulin was used as loading control.

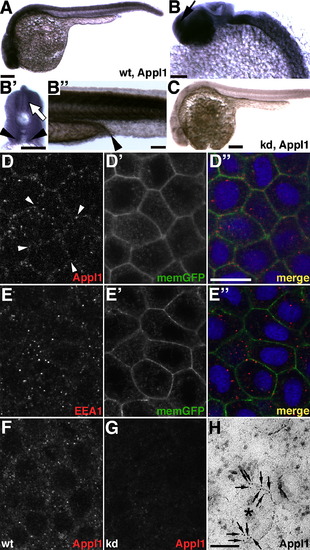
Appl1 Protein and Endosomes during Development
(A) Appl1 protein in a WT zebrafish.
(B) Magnification of a head in lateral view. Arrow, telencephalon.
(B′) Section at the level of the yolk extension. High Appl1 expression in the neural tube (empty arrow) and in the pronephric duct (arrowheads).
(B″) Strong pronephric expression of Appl1, (arrowhead,), lateral view.
(C) Simultaneously performed anti-Appl1 labeling on embryos injected with 10 ng appl1 antisense morpholino. Strongly reduced Appl1 signal provides evidence for specificity of the labeling.
(A–C) Anti-Appl1 whole-mount immunohistochemistry on 26 hr zebrafish. The scale bars represent in (A) and (C), 200 μm; in (B), 100 μm; and in (B′) and (B″), 50 μm.
(D–E″) Immunohistochemistry on zebrafish embryos at 50% epiboly. Immunolabelings have been carried out on a transgenic membrane-GFP (memGFP) line (Cooper et al., 2005) to highlight cell margins.
(D) Anti-Appl1 immunolabeling, (D′) memGFP, (D″) merged image of (D) (in red) and (D′) (in green), nuclear draq is shown in blue. Note that Appl1 endosomes are enriched near cell margins (arrowheads).
(E) Immunolabeling using anti-EEA1, a marker labeling canonical early endosomes, (E′) memGFP, (E″) merged image of (E) (in red) and (E′) (in green), nuclear draq5 staining is shown in blue. EEA1 positive endosomes appear randomly scattered throughout cells.
(F) Anti-Appl1 immunolabeling on brain rudiment during early somite stages.
(G) Strongly reduced Anti-Appl1 immunolabeling on brain rudiment upon injection of 10 ng appl1 antisense morpholino.
(D–G) Single confocal sections are shown. Experiments were performed under the same conditions and microscope settings. The scale bar in (D″) represents 15 μm.
(H) High magnification of an anti-Appl1 immunoelectron micrograph of a 80% epiboly embryo cryosection. A 200 nm vesicle (asterisk) is decorated with anti-Appl1-directed 10 nm gold particles (arrows). The scale bar represents 100 nm.

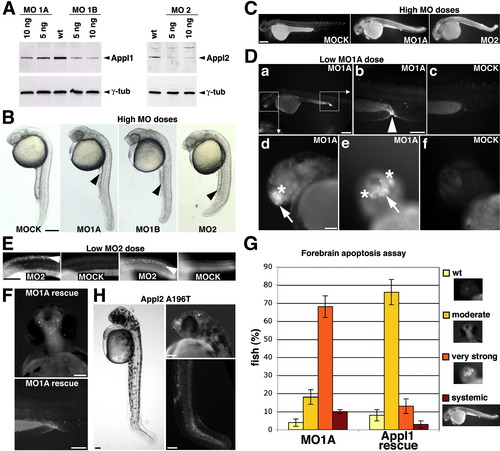
Loss of Appls Causes Apoptosis
(A) Reduction of Appl1 and Appl2 protein levels upon injection of 5 and 10 ng antisense MOs into single-cell stage embryos. Proteins were extracted from 10-somite embryos to illustrate dose-dependent MO-mediated knockdown efficiency. Knockdown efficiency also depends on the stage of extraction (see later extracts, Figure 5A). Two MOs knock down Appl1 (MO1A and MO1B), and one MO knocks down Appl2 (MO2).
(B) Morphological phenotypes of 24 hr zebrafish injected with either injection buffer only (MOCK) or “high” doses of MOs: MO1A (12 ng), MO1B (12 ng), or MO2 (4 ng): reduced yolk extensions and overall sick appearance. The scale bar represents 250 μm.
(C–H) Apoptotic staining by AO (in white) on MOCK-injected, morphant and TILLING zebrafish embryos at 54 hr of development. AO unspecifically accumulates in the yolk.
(C) Wide apoptosis in “high”-dose morphants (MO1A [12 ng] and MO2 [4 ng]). The scale bar represents 250 μm.
(D) Local apoptosis in “low”-dose MO1A morphants (8 ng). (a) Low-dose MO1A embryo, lateral view. Head region magnified in panels (d) and (e) and tails magnified in panel (b) are indicated. (b) Strong apoptosis of the distal pronephric tube. (c) Corresponding region of a MOCK-injected embryo. (d and e) Magnified MO1A head region, lateral (d) and front view (e). Strong apoptosis is observed in forebrain including telencephalon and olfactory placode. (f) Corresponding region of a MOCK-injected embryo (front view). The scale bars represent (a) 250 μm, (b–f) 100 μm.
(E) Local apoptosis in low-dose MO2 morphants (2 ng) is restricted to the neural tube, shown at the level of the yolk extension. Panels to the left, lateral view; panels to the right, top view. The scale bar represents 250 μm.
(F) Rescue of apoptosis in forebrain and pronephros in low-dose MO1A morphants (8 ng) by coinjection of 75 pg appl1 mRNA that lacks the MO1A binding site. The scale bars represent 100 μm.
(G) Forebrain apoptosis assay: Quantitative evaluation of apoptosis in Appl1 knockdown (MO1A: 8 ng MO1A) and rescued zebrafish embryos (Appl1 rescue: 8 ng MO1A + 75 pg appl1 mRNA). Embryos were assigned to one of four cell death categories: WT, moderate, very strong forebrain, and systemic apoptosis (representative images in legend). Total amount of embryos scored: n MO1A = 532; n Appl1 rescue = 598. Error bars indicate SD between experiments. Note that apoptosis is significantly rescued in the majority of embryos.
(H) APPL2A196T mutant fish isolated by TILLING are characterized by reduced yolk extension, kinked tails, apoptosis in the neural tube, and olfactory placodes, resembling appl2 morphants (left panel). The scale bars represent 100 μm.

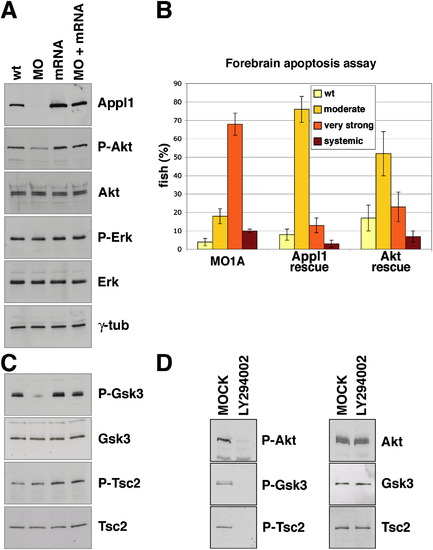
Appl1 Regulates Akt Activity, Akt Substrate Specificity, and Akt-Dependent Survival in Zebrafish Development
(A) Western blot analyses of Akt and MAPK level and activity in WT, Appl1 knockdown (MO: 8 ng MO1A), Appl1 overexpressing (mRNA: 75 pg appl mRNA), and rescued embryos (MO + mRNA: 8 ng MO1A + 75 pg appl mRNA).
(B) Forebrain apoptosis assay: Quantitative evaluation of apoptosis in Appl1 knockdown embryos rescued by expression of Akt (Akt rescue: 8 ng MO1A + 100 pg Akt2 mRNA). Embryos were assigned to one of the four indicated cell death categories. Evaluation of Appl1 knockdown and appl1 mRNA-rescued embryos (Figure 4G) are shown for comparison. Total amount of embryos scored: n Akt rescue = 396. Error bars indicate standard deviation (SD) amongst five experiments.
(C) Western blot analyses on the same fish extracts analyzed in panel (A) monitoring level and activity of Gsk-3β and Tsc2.
(D) Western blot analyses of MOCK and LY294002-treated fish. (Ser9)-Gsk-3β and (Thr1462) phosphorylation critically depends on Akt activity.
(A–D) Experiments have been carried out on 54 hr zebrafish embryos.

EXPRESSION / LABELING:
Gene:
Antibodies:
Fish:
Condition:
Knockdown Reagent:
Anatomical Term:
Stage: Long-pec
PHENOTYPE:
Fish:
Knockdown Reagent:
Observed In:
Stage: Long-pec

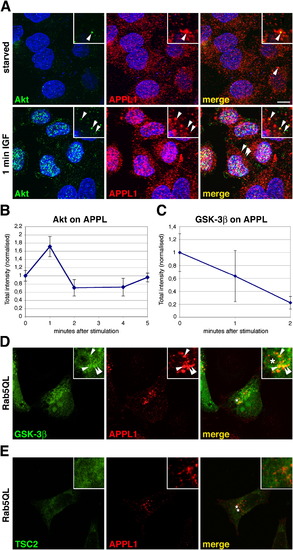
Akt and GSK-3β, but Not TSC2, Colocalize with APPL1 on Endosomes
(A) Colocalization of endogenous Akt and APPL1 in permeabilized HeLa cells before (upper panels) and after 1 min IGF-1 stimulation (lower panels).
(B) Quantitative evaluation of anti-Akt fluorescence intensity on APPL endosomes. HeLa cells were starved and stimulated with IGF-1 for 1, 2, 4, and 5 min. Akt fluorescence intensities were normalized against the fluorescence value in the starved condition. Error bars represent SEM.
(C) Quantitative evaluation of GFP-GSK-3β fluorescence intensity on APPL1 endosomes after extraction, carried out as described in (A).
(D) HeLa cells double-transfected with GFP-GSK-3β and a constitutively active form of Rab5, Rab5Q79L, immunolabeled with anti-APPL1 (in red). Rab5Q79L induces the formation of enlarged endosomes (labeled by an asterisk, merge panel) and recruites APPL1 and GSK-3β.
(E) HeLa cells double transfected with flag-TSC2 and Rab5QL and immunolabeled with anti-flag (in green) and anti-APPL1 (in red). Asterisks label Rab5Q79L -induced enlarged endosomes (labeled by asterisks, merge panel). The TSC2 signal in insets has been enhanced to demonstrate that even the residual TSC2 remained after extraction shows a localization pattern different from Appl1.
(A, D, and E) Arrowheads point to endosomes that show colocalization, magnified in insets. The scale bar (in [A]) represents 10 μm.

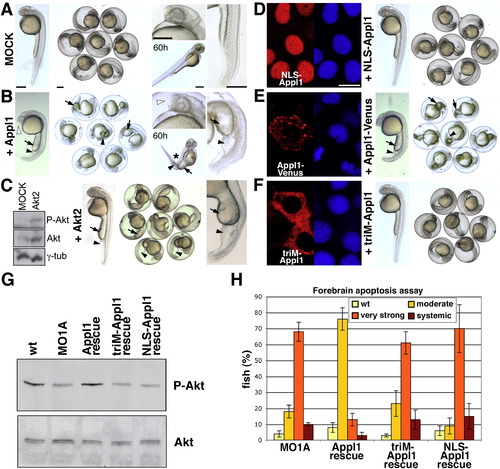
Appl1-Mediated Gain-of-Function Phenotypes and Survival Signaling Depend on Its Endosomal Localization
(A) Morphology of control embryos, injected with buffer only.
(B) Morphology of embryos injected with 500 pg appl1 mRNA. Note the thick yolk extension (arrows), blown up blood island (black arrowheads), and swollen telencephalon (white arrowheads).
(C) Western blot analysis and morphology of embryos overexpressing Akt2. Total and P-Akt levels are elevated in embryos that have been injected with 300 pg akt2 mRNA. γ-tubulin (γ-tub) was used as a loading control. The embryo on the left has received 300 pg mRNA, others 600 pg. Note thick yolk extensions (arrows) and blown up blood island (black arrowheads).
(D) Appl1 fused to a Nuclear Localization Signal (NLS-Appl1) is targeted to the nucleus and does not evoke phenotypes.
(E) Appl1 fused to a bulky tag (Appl1-Venus) is excluded from the nucleus and causes phenotypes identical to the one evoked by overexpression of WT Appl1 (B).
(F) Appl1 carrying the R147A, K153A, K155A triple mutation (triM-Appl1) fails to associate with endosomes and does not evoke phenotypes.
(A–F) Embryos after 26 hr of development, unless labeled otherwise. The scale bars (in [A]) represent 250 μm.
(D–F) Localization of three engineered Appl1 proteins and morphology of embryos injected with 500 pg of mRNA, respectively. Anti-Appl1 (red) and nuclear draq5 staining (blue). The scale bar (in [D]) represents 10 μm.
(G) Evaluation of Akt activity in WT, Appl1 knockdown (MO1A: 8 ng MO1A), and embryos in which a rescue with the WT appl1 mRNA (Appl1 rescue: 8 ng MO1A + 75 pg appl1 mRNA lacking MO1A binding site), the soluble triM-Appl1 (triM-Appl1 rescue: 8 ng MO1A + 75 pg triM-appl1 mRNA lacking MO1A binding site), or the nuclear NLS-Appl1 mutant (NLS-Appl1 rescue: 8 ng MO1A + 75 pg NLS-appl1 mRNA lacking MO1A binding site) has been attempted.
(H) Forebrain apoptosis assay: Quantitative comparison of apoptosis in embryos manipulated as in (G). Embryos were assigned to one of the four indicated cell death categories. Evaluation of Appl1 knockdown and WT appl1 mRNA–rescued embryos (Figure 4G), are shown again for comparison. Total amount of embryos scored: ntriM-Appl1 rescue = 567, nNLS-Appl1 rescue = 502. Error bars indicate SD amongst five experiments.
(G and H) Experiments have been carried out on 54 hr zebrafish embryos.

EXPRESSION / LABELING:
Antibodies:
Fish:
Knockdown Reagent:
Anatomical Term:
Stage: Long-pec
PHENOTYPE:
Fish:
Knockdown Reagent:
Observed In:
Stage: Long-pec

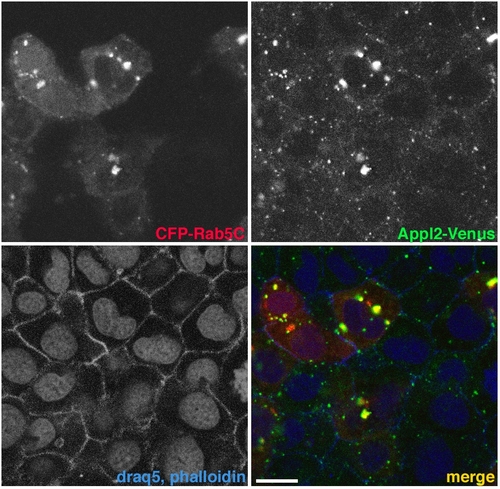
Appl2 localization and recruitment to Rab5C-labeled endosomes.
Zebrafish embryos were injected with 100 pg appl2-Venus mRNA at 1 cell stage and with 50 pg CFP-Rab5C mRNA into single blastomeres at 16-cell stage, fixed and imaged at 50% epiboly stage. A single confocal section is shown, represented proteins are indicated. Draq5 and phalloidin staining highlight nuclei and cell margins. Note that the distribution of ubiquitously expressed Appl2-Venus is altered in all CFP-Rab5C co-expressing cells. Bigger and brighter structures are observed. Scale bar: 10 μm.

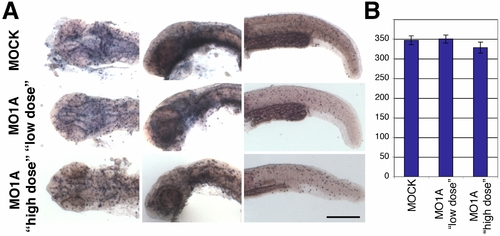
appl1 morphants show no significant differences in cell proliferation.
(A) Zebrafish embryos injected with injection buffer only (MOCK), 8 ng („low dose“) or 12 ng („high dose“) MO1A, immunostained with anti-P-Histone H3 antibodies (in purple) to highlight mitotic cells. Top and side views of heads and side views of tails are shown (from the left to the right). Scale bar: 250 μm.
(B) Quantification of anti-P-Histone H3 labeled cell in zebrafish heads (including midbrain hindbrain boundary) as shown in (A), left panels. 5 heads per genotype have been evaluated. Error bars indicate standard deviation. Despite the occurring apoptosis (see Figure 4), no significant changes in the number of mitotic cells were found (P values > 0,15).

EXPRESSION / LABELING:
Antibody:
Fish:
Knockdown Reagent:
Anatomical Term:
Stage: Long-pec
PHENOTYPE:
Fish:
Knockdown Reagent:
Observed In:
Stage: Long-pec

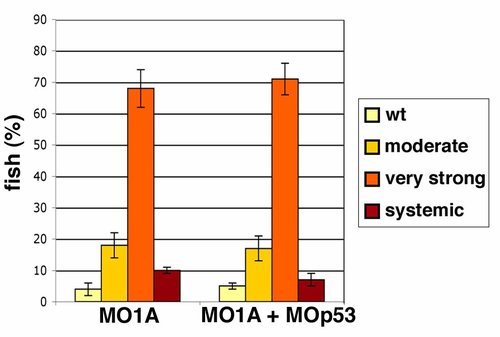
Concurrent downregulation of p53 does not affect APPL1 knock-down induced apoptosis.
Forebrain apoptosis assay: Quantitative evaluation of apoptosis in appl1 morphants (8 ng MO1A) in which unspecific cell death is blocked by concurrent knock-down of p53 (MO1A + MOp53: 8 ng MO1A + 4 ng MOp53). Embryos were assigned to one of four cell death categories: wt, moderate, very strong forebrain and systemic apoptosis. 5 independent experiments were carried out. Evaluation of Appl1 knockdown (MO1A: 8 ng MO1A) embryos (presented in Figure 4G) is shown again for comparison. Total amount of embryos scored: n MO1A= 532, n MO1A+Mop53= 486. Error bars indicate standard deviation between experiments. All experiments have been carried out on 54 h zebrafish embryos. Efficient knock-down of p53 by 2 ng of the utilized MOp53 has been previously demonstrated (Nowak et al., 2005).

PHENOTYPE:
Fish:
Knockdown Reagents:
Observed In:
Stage: Long-pec

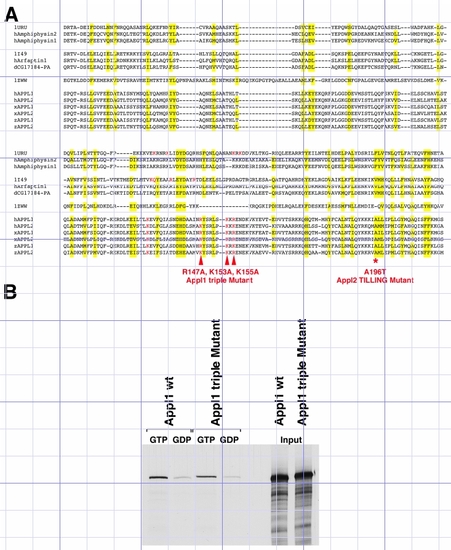
Appl mutants
(A) Multiple Sequence Alignment of the BAR domain from members of the Amphiphysin-, Arfaptin-, Endophilin- and APPL- families. Conserved residues between all family members are highlighted in yellow. Residues required for membrane interaction of Amphiphysin (1URU) and Arfaptin (1I49) (Peter et al., 2004) as well as corresponding residues in APPLs are shown in red. Three of those residues in Appl1 were mutated to Alanine (R147, K153, K155; corresponding to residues 146, 152, 154 in the human protein) and are referred to as Appl1 triple Mutant.
A conserved Alanine (A196) in Appl2 was hit by tilling (Appl2 tilling mutant). Abbreviations and Accession numbers are as follows: h: Homo sapiens; d: Drosophila melanogaster; x: Xenopus laevis; z: Danio rerio; hAmphiphysin: NP_647594; hAmphphysin2: NP_647593; hArfaptin1: NP_001020766; dCG17184-PA: NP_650058; hAPPL1: NP_036228; hAPPL2: NP_060641; xAPPL1: NP_001083547; xAPPL2: NP_001087772; zAPPL1 (for Appl1): EU053152; zAPPL2 (for Appl2): EU053153.
(B) GST-pull down assays using recombinant Rab5C protein, loaded with either GTPγS (+GTP) or GDP (+GDP) nucleotides. In vitro translated Appl1 wt and Appl1 triple Mutant proteins are bound specifically by the activated, GTP-bound form of the small GTPase.

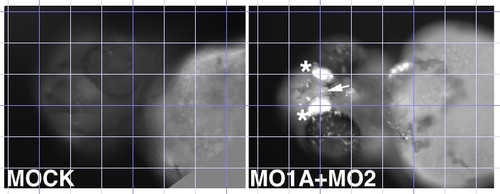
Appl1 and Appl2 double knock-down
Apoptotic staining by AO (in white) on MOCK injected and Appl1/2 “low dose” double knock-down fish. 8 ng MO1A and 2 ng MO2 have been injected. Not the dramatic apoptosis in the olfactory system (asterisks), which is less pronounced in Appl1 morphants (see Figure 4). In contrast, apoptosis in the telencephalon (arrow) is of comparable level.

PHENOTYPE:
Fish:
Knockdown Reagents:
Observed In:
Stage: Unknown

Unillustrated author statements

Acknowledgments
This image is the copyrighted work of the attributed author or publisher, and ZFIN has permission only to display this image to its users. Additional permissions should be obtained from the applicable author or publisher of the image.

Reprinted from Cell, 133(3), Schenck, A., Goto-Silva, L., Collinet, C., Rhinn, M., Giner, A., Habermann, B., Brand, M., and Zerial, M., The endosomal protein Appl1 mediates Akt substrate specificity and cell survival in vertebrate development, 486-497, Copyright (2008) with permission from Elsevier. Full text @ Cell