Fig. 3
Appl1 Protein and Endosomes during Development
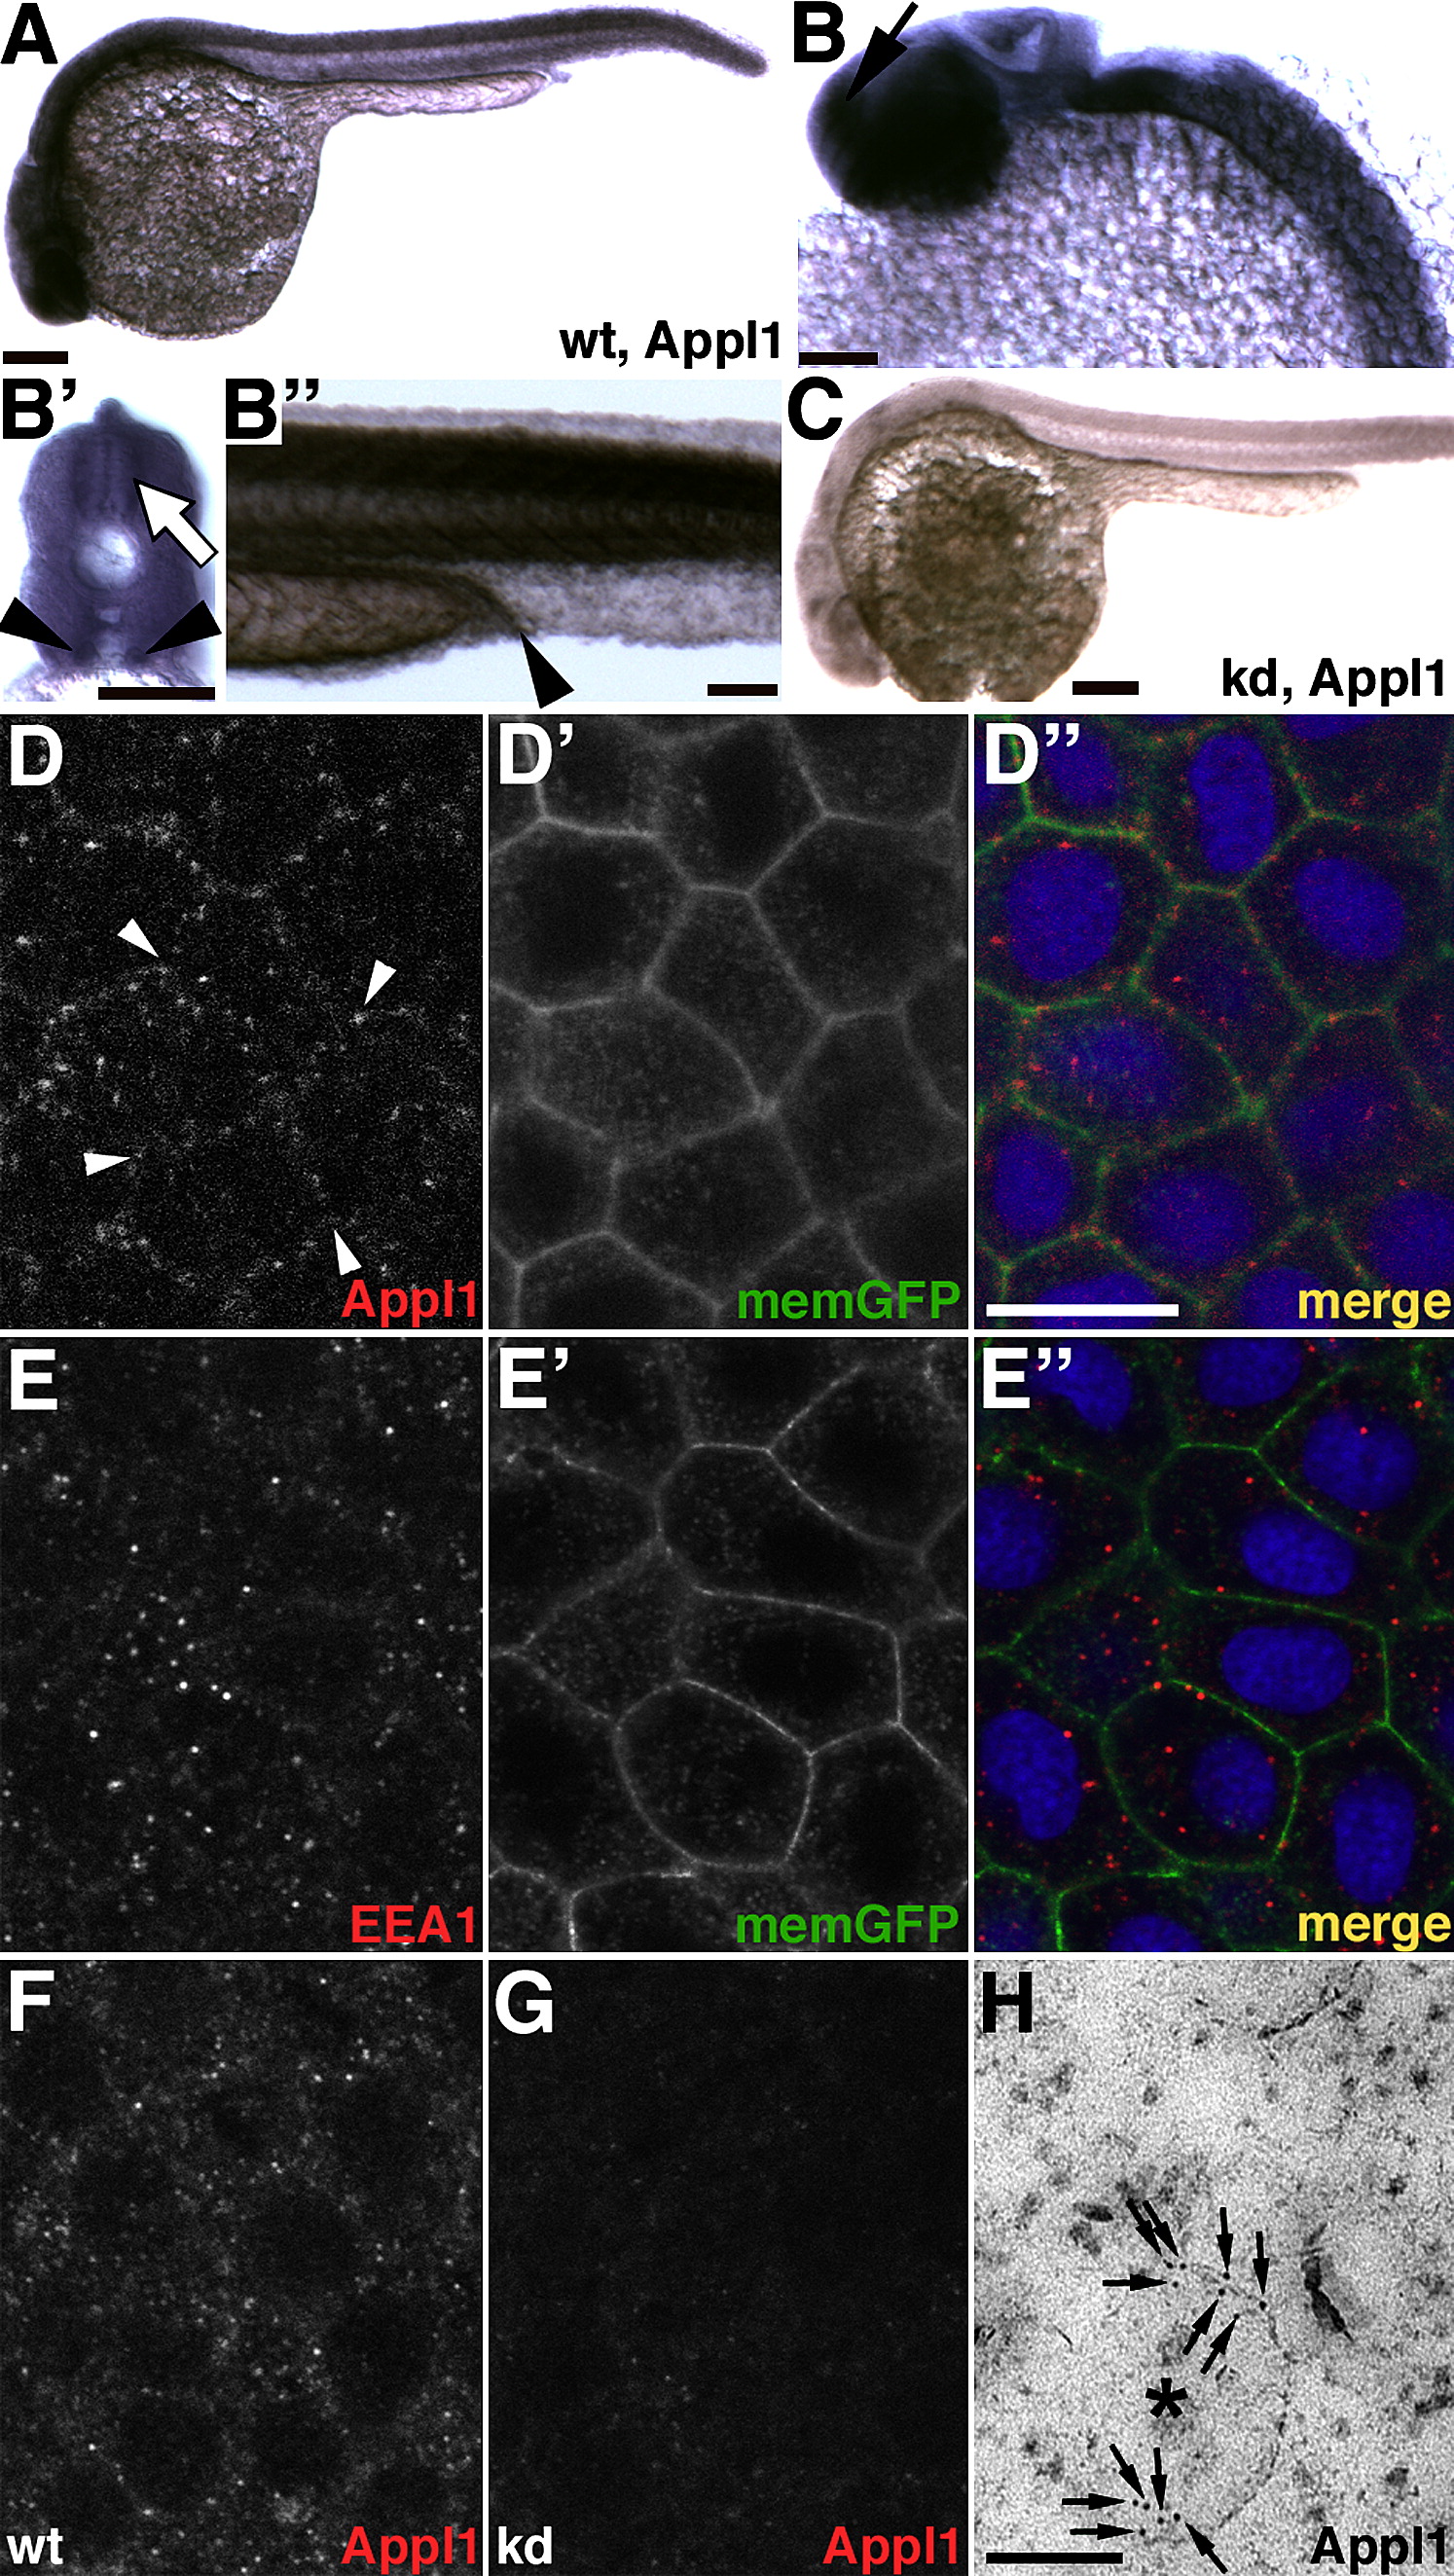
(A) Appl1 protein in a WT zebrafish.
(B) Magnification of a head in lateral view. Arrow, telencephalon.
(B′) Section at the level of the yolk extension. High Appl1 expression in the neural tube (empty arrow) and in the pronephric duct (arrowheads).
(B″) Strong pronephric expression of Appl1, (arrowhead,), lateral view.
(C) Simultaneously performed anti-Appl1 labeling on embryos injected with 10 ng appl1 antisense morpholino. Strongly reduced Appl1 signal provides evidence for specificity of the labeling.
(A?C) Anti-Appl1 whole-mount immunohistochemistry on 26 hr zebrafish. The scale bars represent in (A) and (C), 200 μm; in (B), 100 μm; and in (B′) and (B″), 50 μm.
(D?E″) Immunohistochemistry on zebrafish embryos at 50% epiboly. Immunolabelings have been carried out on a transgenic membrane-GFP (memGFP) line (Cooper et al., 2005) to highlight cell margins.
(D) Anti-Appl1 immunolabeling, (D′) memGFP, (D″) merged image of (D) (in red) and (D′) (in green), nuclear draq is shown in blue. Note that Appl1 endosomes are enriched near cell margins (arrowheads).
(E) Immunolabeling using anti-EEA1, a marker labeling canonical early endosomes, (E′) memGFP, (E″) merged image of (E) (in red) and (E′) (in green), nuclear draq5 staining is shown in blue. EEA1 positive endosomes appear randomly scattered throughout cells.
(F) Anti-Appl1 immunolabeling on brain rudiment during early somite stages.
(G) Strongly reduced Anti-Appl1 immunolabeling on brain rudiment upon injection of 10 ng appl1 antisense morpholino.
(D?G) Single confocal sections are shown. Experiments were performed under the same conditions and microscope settings. The scale bar in (D″) represents 15 μm.
(H) High magnification of an anti-Appl1 immunoelectron micrograph of a 80% epiboly embryo cryosection. A 200 nm vesicle (asterisk) is decorated with anti-Appl1-directed 10 nm gold particles (arrows). The scale bar represents 100 nm.
Reprinted from Cell, 133(3), Schenck, A., Goto-Silva, L., Collinet, C., Rhinn, M., Giner, A., Habermann, B., Brand, M., and Zerial, M., The endosomal protein Appl1 mediates Akt substrate specificity and cell survival in vertebrate development, 486-497, Copyright (2008) with permission from Elsevier. Full text @ Cell

