Fig. 3
- ID
- ZDB-FIG-240903-164
- Publication
- Wong et al., 2024 - ALS-linked VapB P56S mutation alters neuronal mitochondrial turnover at the synapse
- Other Figures
- All Figure Page
- Back to All Figure Page
|
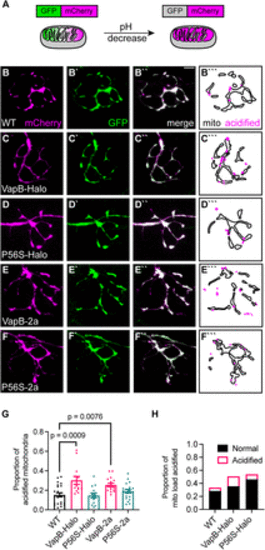
VapB expression increases mitophagy in the axon terminal. A, Schematic of mitophagy indicator mito-GFP-mCherry localization and fluorescence in the mitochondrion. In low pH, such as in a lysosome, the GFP is quenched. B?D, Representative images of axon terminals expressing the mitophagy indicator in WT (B), VapB-HaloTag transgenic (VapB-Halo; C), VapBP56S-HaloTag transgenic (P56S-Halo; D), VapB-p2a-TagBFP transgenic (VapB-2a; E), and VapBP56S-p2a-TagBFP transgenic (P56S-2a; F). Distribution of acidified (magenta) and unacidified (outline) mitochondria is illustrated (B```?F```). G, Proportion of acidified mitochondria relative to the total mitochondrial population. H, Proportion of mitochondrial load acidified (mCherry-only mitochondrial area/average mitochondrial axon terminal load derived from Fig. 1H). Scale bar, 5 ?m in B``. Each data point for G represents the average calculated from an individual animal. All data represented as mean ± SEM. ANOVA with Dunnett's post hoc contrasts in G. |

