Fig. 1
- ID
- ZDB-FIG-240903-162
- Publication
- Wong et al., 2024 - ALS-linked VapB P56S mutation alters neuronal mitochondrial turnover at the synapse
- Other Figures
- All Figure Page
- Back to All Figure Page
|
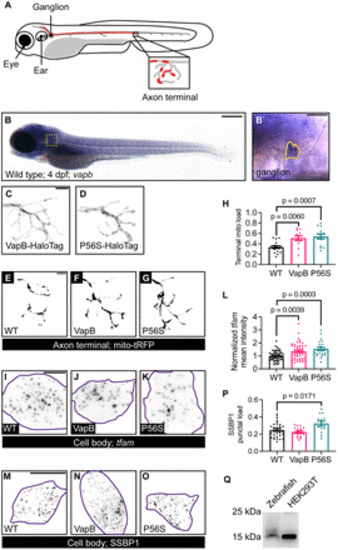
VapB regulates mitochondrial density in the axon terminal. A, Schematic of the pLL in the zebrafish larva. Neuronal cell bodies reside in the pLL ganglion and extend axons down the trunk. Single axon in red. Axon terminal in inset. A fraction of the axon terminal is occupied by mitochondria (red in inset). B, In situ hybridization of vapb at 4 dpf. vapb is enriched in pLL neuron cell bodies. pLL ganglion boxed in B, outlined in B`. C, D, Representative images of pLL axon terminals expressing VapB (C) or VapBP56S (P56S; D) tagged with a HaloTag. E?G, Representative images of mitochondria visualized with matrix-localized TagRFP (tRFP) in axon terminal of WT (E), VapB transgenic (F), or VapBP56S transgenic (G) larvae at 4 dpf. (H) Quantification of mitochondrial load (mitochondrial area/axon terminal area) with manipulation of VapB. I?K, Images of tfam HCR RNA FISH from single pLL neuron (purple outline) coexpressing GFP (I), VapB (J), or VapBP56S (K). L, Quantification of tfam mean fluorescence intensity normalized to WT. M?O, Representative images of SSBP1 immunostaining in single pLL neurons (purple outline) coexpressing GFP (M), VapB (N), or VapBP56S (O). P, Quantification of the SSBP1 puncta number normalized to the cell body area. Q, Anti-SSBP1 Western blot of WT larval protein extract and HEK293T cell lysate. Scale bar: 200 ?m in B; 50 ?m in B`; 5 ?m in C and E; 10 ?m in I and M. Each data point represents the average calculated from an individual animal. All data represented as mean ± SEM. ANOVA with Dunnett's post hoc contrasts in H, L, and P. |

