Fig. 2
- ID
- ZDB-FIG-240903-163
- Publication
- Wong et al., 2024 - ALS-linked VapB P56S mutation alters neuronal mitochondrial turnover at the synapse
- Other Figures
- All Figure Page
- Back to All Figure Page
|
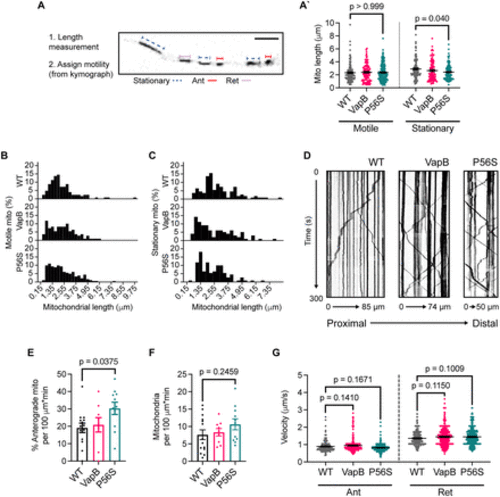
VapBP56S expression decreases mitochondrial length and increases mitochondrial anterograde transport. A, Average length of motile (left) and stationary (right) mitochondria with VapB and VapBP56S transgenic expression. Schematic of mitochondrial length measurement in A. The long axis of mitochondria was measured as the length. B, C, Frequency distribution histograms of mitochondrial lengths for motile (B) and stationary mitochondria (C) in pLL axons. The number of mitochondria and animals analyzed: WT, 124, 14; VapB, 110, 9; and P56S, 182, 11 for motile mitochondria (B), and WT, 109, 13; VapB, 98, 9; and P56S, 110, 11 for stationary mitochondria (C). D, Example kymographs of mitochondrial transport in WT, VapB transgenic, and VapBP56S transgenic backgrounds. E, F, Quantification of the number of mitochondria moving in the anterograde direction (E) and total number of mitochondria (F) in pLL axons. Each data point represents the average calculated from an individual animal. G, Analysis of average anterograde (Ant; left) and retrograde (Ret; right) transport velocity. The number of mitochondria and animals analyzed: WT, 161, 17; VapB, 331, 9; and P56S, 625, 13 for anterograde transport, and WT, 262, 16; VapB, 427, 8; and P56S, 471, 12 for retrograde transport. All data represented as mean ± SEM. Kruskal?Wallis test with Dunn's post hoc contrasts in A and G. ANOVA with Dunnett's post hoc contrasts in E and F. |

