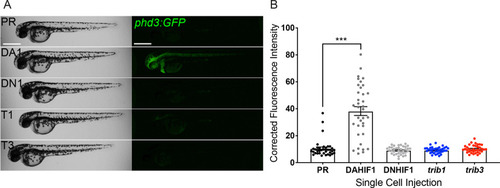
Figure 7.

trib1 and trib3 overexpression do not induce expression of the Hif reporter phd3:GFP.

(A) Stereo-fluorescence micrographs of 2 dpf phd3:GFP larvae injected with phenol red (PR), dominant active hif-1α (DA1) and dominant negative Hif-1α (DN1) RNA controls alongside trib1 (T1) and trib3 (T3) RNA. Scale bars = 200 µM. (B) Corrected fluorescence intensity levels of phd3:GFP (Hif reporter) larvae shown in (A). Data shown are mean ± standard error of the mean (SEM), n = 30 embryos accumulated from three independent experiments. Statistical significance determined through one-way analysis of variance (ANOVA) with multiple comparisons. p values shown are: ***p < 0.001.

Expression Data

Expression Detail
Antibody Labeling
Phenotype Data

Phenotype Detail
Acknowledgments
This image is the copyrighted work of the attributed author or publisher, and ZFIN has permission only to display this image to its users. Additional permissions should be obtained from the applicable author or publisher of the image. Full text @ Elife