
Figure 1
- ID
- ZDB-FIG-240620-240
- Publication
- Hammond et al., 2024 - Tribbles1 is host protective during in vivo mycobacterial infection
- Other Figures
- All Figure Page
- Back to All Figure Page
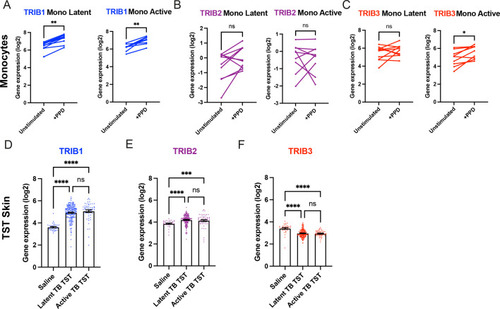
Expression of TRIB1 in human monocytes and tissues is elevated after mycobacterial antigen stimulation. (A–C) Expression of TRIB1, TRIB2, and TRIB3 transcripts in human CD14+ monocytes in patients with active or latent TB before and after 4 hr of Mtb protein derivative (PPD) stimulation in vitro. Each paired data point represents one individual, with active or latent TB (n = 9 and n = 7, respectively). Statistical significance determined by paired Wilcoxon tests. p values shown are: *p < 0.05 and **p < 0.01. (D–F) Expression of TRIB1, TRIB2, and TRIB3 within in saline injected human skin and from biopsies of the site of a tuberculin skin test (TST) in patients with active or latent TB. Each point represents one individual with bars for each group representing mean gene expression. n = 48 and 191 individuals with active or latent TB, respectively. Statistical significance determined via Kruskal–Wallis with multiple comparisons. p values shown are: ***p < 0.001 and ****p < 0.0001. |