
Fig. 5
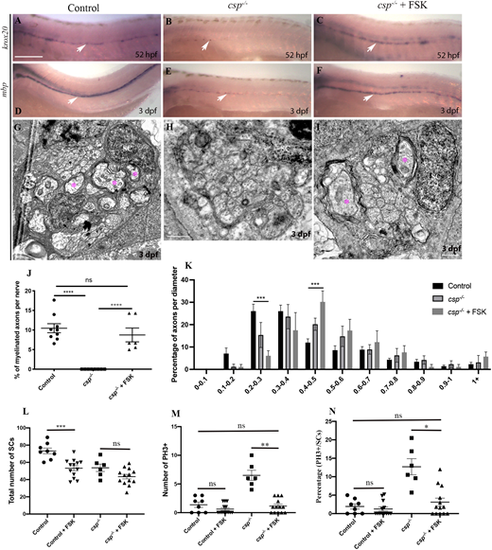
sil is required to initiate myelin gene expression and axonal wrapping by SCs via a cAMP-dependent pathway. (A-C) Lateral views of krox20 expression at 52 hpf revealed by in situ hybridization along the PLLn in control (A) showing a robust expression (n=29 embryos), csp?/? embryo (B) showing a sharp decrease in krox20 expression (n=22 embryos) and in csp?/? treated with FSK (C) showing a robust expression similar to controls (n=30 embryos). Arrows indicate SCs expressing krox20 along the PLLn. (D-F) Lateral views of mbp expression at 3 dpf revealed by in situ hybridization along the PLLn in control (D) showing a robust expression (n=31 embryos), csp?/? embryo (E) showing a sharp decrease in mbp expression (n=24 embryos) and in csp?/? treated with FSK (F) showing a robust expression similar to controls (n=28 embryos). Arrows indicate SCs expressing mbp along the PLLn. Scale bar: 200 ?m. (G-I) TEM of a cross-section of the PLLn at 3 dpf in control (G), csp?/? (H) and csp?/? treated with FSK between 45 and 52 hpf (I). Magenta asterisks indicate some large caliber myelinated axons. Scale bars: 0.5 ?m. (J) Quantification of the percentage of myelinated axons relative to the total number of axons per nerve at 3 dpf in controls (average of 10.6�1.17), csp?/? (average of 0) and csp?/? treated with FSK (average of 8.74�1.77, six nerves, n=5 embryos) (****P?0.0001; ns, P=0.4846). (K) Graph representing the distribution of axons relative to their diameter with 0.1 �m bin width at 3 dpf in controls, csp?/? and csp?/? embryos treated with FSK (***P=0.0001 for 0.2-0.3; ***P=0.0007 for 0.4-0.5). (L) Quantification of the number of SCs within a defined region of the PLLn at 54 hpf in control (average of 73.25�3.36 cells, n=8 embryos), control treated with FSK (average of 53.23�2.89 cells, n=13 embryos), csp?/? (average of 53.68�4.28, n=6 embryos) and csp?/? treated with FSK (average of 43.46�2.65 cells, n=13 embryos). (***P=0.0005; ns, P=0.27). (M) Quantification of the number of PH3+ SCs within a defined region of the PLLn at 54 hpf in control (average of 1.37�0.46 cells, n=8 embryos), control treated with FSK (average of 0.61�0.24 cells, n=13 embryos), csp?/? (average of 6.50�0.88 cells, n=6 embryos) and csp?/? treated with FSK (average of 1.15�0.33 cells, n=13 embryos) (ns, P>0.9999; **P=0.004). (N) Quantification of the percentage of PH3+ SCs relative to the total number of SCs within a defined region of the PLLn at 54 hpf in control (average of 1.93�0.69 cells, n=8 embryos), control treated with FSK (average of 1.26�0.54 cells, n=13 embryos), csp?/? (average of 12.70�2.17 cells, n=6 embryos) and csp?/? treated with FSK (average of 3.10�1.07 cells, n=13 embryos) (ns, P>0.9999; *P=0.018). |