
Fig. 4
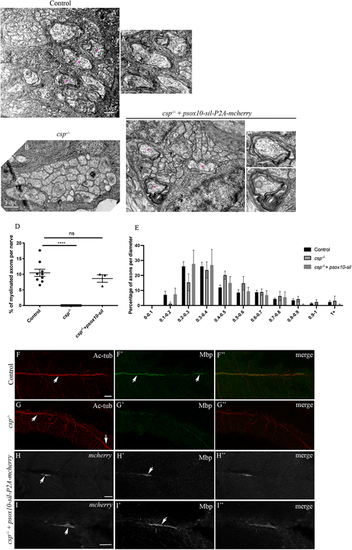
Sil is required within SCs for axonal wrapping. (A-C?) TEM of a cross-section of the PLLn at 3 dpf in control (A,A?), csp?/? (B) and csp?/? embryos injected with psox10-sil-P2A-mCherry (C-C?). Magenta asterisks indicate some large caliber myelinated axons (shown at higher magnification in A?, C?, C?). Scale bars: 0.5 ?m (A-C); 0.2 �m (C?,C?). (D) Quantification of the percentage of myelinated axons relative to the total number of axons in control (average of 10.46�1.14%, nine nerves, n=5 embryos), csp?/? (0%, eight nerves, n=6 embryos) and csp?/? injected with psox10-sil-P2A-mCherry (average of 8.64�1.20%, three nerves, n=3 embryos) (****P?0.0001; ns, P=0.4871). (E) Graph representing the distribution of axons relative to their diameter with 0.1 �m bin width at 3 dpf in controls, csp?/? and csp?/? embryos injected with psox10-sil-P2A-mCherry. (F-I?) Acetylated tubulin (Ac-tub) and Mbp immunolabeling in control (F-F?), csp?/? (G-G?) and csp?/?+psox10-sil-P2A-mCherry (H-I?) embryos at 3 dpf. Arrows indicate the PLLn in F and G, the myelin sheaths in F?, mCherry+ Schwann cells along the PLLn in H and I and the corresponding Mbp expression in H? and I?. F?, G?, H? and I? are the corresponding merge images of F and F?, G and G?, H and H?, I and I?, respectively. Scale bars: 20 ?m. |