
Fig. 8
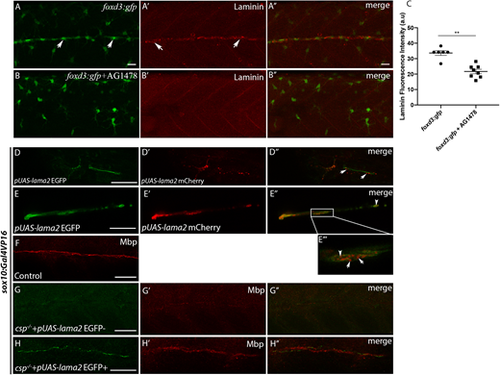
Laminin expression is significantly reduced in AG1478-treated embryos and Laminin ?2 overexpression within SCs restores normal Mbp expression in csp?/? embryos. (A-B?) Laminin immunostaining in foxd3:gfp (A-A?) and foxd3:gfp embryos treated with AG1478 (B-B?) at 48 hpf. Arrows indicate GFP+ SCs in A and laminin expression along the PLLn in A?. Scale bars: 20 ?m. A? and B? are the merge images of A and A? and of B and B?, respectively. (C) Quantification of laminin fluorescence intensity along the PLLn in foxd3:gfp (average of 33.63�1.52, n=6 embryos) and foxd3:gfp/AG1478-treated (average of 21.67�1.44, n=8 embryos) embryos (**P=0.0013), a.u., arbitrary unit. (D,E) Lateral views of EGFP expression in SCs of the PLLn following pUAS-lama2 injection in sox10:Gal4VP16 embryos. Scale bars: 20 ?m. (D?,E?) Lateral views of mCherry-tagged secreted laminin in SCs and within the PLLn. (D?,E?) Merge of D and D? and of E and E?, respectively. mCherry-tagged secreted laminin is highlighted in E? at higher magnification; white arrows in D? and E? indicate extracellular laminin within the PLLn and white arrowheads in E? and E? indicate mCherry-tagged laminin within SCs. (F) Lateral view of Mbp immunolabeling in control embryo at 3 dpf. Scale bar: 50 ?m. (G,G?) Lateral view showing the absence of EGFP expression in SCs of the PLLn (G) that correlates with a significant decrease in Mbp immunolabeling (G?) following pUAS-lama2 injection but with no EGFP/mCherry expression in csp?/?/sox10:Gal4VP16 embryos. n=24. Scale bar: 50 ?m. (G?) Merge of G and G?. (H,H?) Lateral view showing EGFP expression in SCs of the PLLn that correlates with normal Mbp immunolabeling (H?) following pUAS-lama2 injection with positive clones of EGFP/mCherry in csp?/?/sox10:Gal4VP16 embryos. n=8. Scale bar: 20 ?m. (H?) Merge of H and H?. |