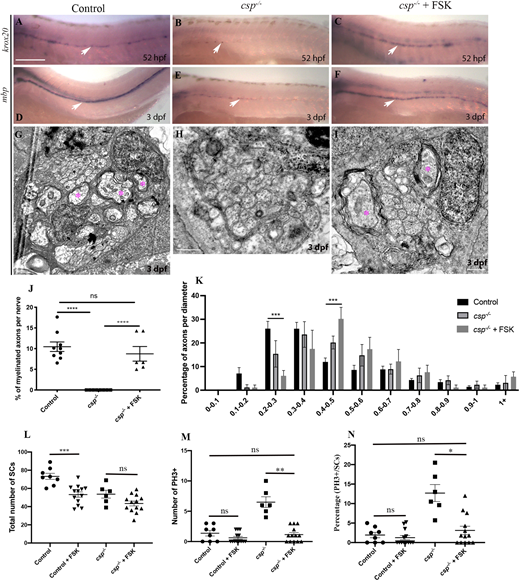
Fig. 5 sil is required to initiate myelin gene expression and axonal wrapping by SCs via a cAMP-dependent pathway. (A-C) Lateral views of krox20 expression at 52 hpf revealed by in situ hybridization along the PLLn in control (A) showing a robust expression (n=29 embryos), csp?/? embryo (B) showing a sharp decrease in krox20 expression (n=22 embryos) and in csp?/? treated with FSK (C) showing a robust expression similar to controls (n=30 embryos). Arrows indicate SCs expressing krox20 along the PLLn. (D-F) Lateral views of mbp expression at 3 dpf revealed by in situ hybridization along the PLLn in control (D) showing a robust expression (n=31 embryos), csp?/? embryo (E) showing a sharp decrease in mbp expression (n=24 embryos) and in csp?/? treated with FSK (F) showing a robust expression similar to controls (n=28 embryos). Arrows indicate SCs expressing mbp along the PLLn. Scale bar: 200 ?m. (G-I) TEM of a cross-section of the PLLn at 3 dpf in control (G), csp?/? (H) and csp?/? treated with FSK between 45 and 52 hpf (I). Magenta asterisks indicate some large caliber myelinated axons. Scale bars: 0.5 ?m. (J) Quantification of the percentage of myelinated axons relative to the total number of axons per nerve at 3 dpf in controls (average of 10.6▒1.17), csp?/? (average of 0) and csp?/? treated with FSK (average of 8.74▒1.77, six nerves, n=5 embryos) (****P?0.0001; ns, P=0.4846). (K) Graph representing the distribution of axons relative to their diameter with 0.1 Ám bin width at 3 dpf in controls, csp?/? and csp?/? embryos treated with FSK (***P=0.0001 for 0.2-0.3; ***P=0.0007 for 0.4-0.5). (L) Quantification of the number of SCs within a defined region of the PLLn at 54 hpf in control (average of 73.25▒3.36 cells, n=8 embryos), control treated with FSK (average of 53.23▒2.89 cells, n=13 embryos), csp?/? (average of 53.68▒4.28, n=6 embryos) and csp?/? treated with FSK (average of 43.46▒2.65 cells, n=13 embryos). (***P=0.0005; ns, P=0.27). (M) Quantification of the number of PH3+ SCs within a defined region of the PLLn at 54 hpf in control (average of 1.37▒0.46 cells, n=8 embryos), control treated with FSK (average of 0.61▒0.24 cells, n=13 embryos), csp?/? (average of 6.50▒0.88 cells, n=6 embryos) and csp?/? treated with FSK (average of 1.15▒0.33 cells, n=13 embryos) (ns, P>0.9999; **P=0.004). (N) Quantification of the percentage of PH3+ SCs relative to the total number of SCs within a defined region of the PLLn at 54 hpf in control (average of 1.93▒0.69 cells, n=8 embryos), control treated with FSK (average of 1.26▒0.54 cells, n=13 embryos), csp?/? (average of 12.70▒2.17 cells, n=6 embryos) and csp?/? treated with FSK (average of 3.10▒1.07 cells, n=13 embryos) (ns, P>0.9999; *P=0.018).
Image
Figure Caption
Acknowledgments
This image is the copyrighted work of the attributed author or publisher, and
ZFIN has permission only to display this image to its users.
Additional permissions should be obtained from the applicable author or publisher of the image.
Full text @ Development

