|
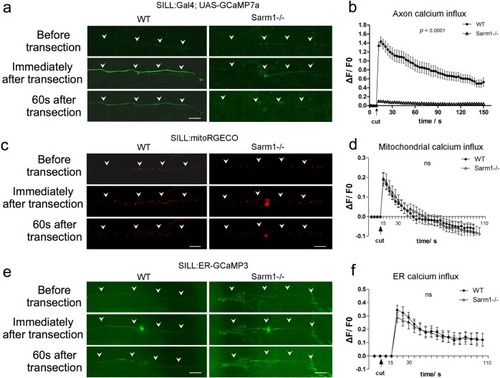
Loss of Sarm1 attenuates Ca<sup>2+</sup> influx to the axoplasm of severed axons, but not Ca<sup>2+</sup> uptake in mitochondria or the ER.a Confocal image of a single lateralis sensory axon expressing the green-fluorescent calcium sensor GCaMP7a in wild type (left column) and Sarm1−/− fish (right column). Rows show that the same samples before laser-mediated transection (top), immediately after transection (middle), and 60 s after transection (bottom). In a, c, and e, white arrowheads indicate the position of the axon, specifically when signal-to-background is low. Scale bar 20 μm. b shows quantification of the first wave of axoplasmic calcium. Data are shown as mean ± SEM; p from one-way ANOVA, wild type n = 16, Sarm1−/− 16. c shows a confocal image of lateralis sensory axons expressing the red-fluorescent calcium sensor RGECO in wild type (left column) and Sarm1−/− fish (right column). Rows show that same samples before laser-mediated transection (top), immediately after transection (middle), and 60 s after transection (bottom). d Quantification mitochondrial calcium influx shows the strong and nearly identical elevation and decay in wild type and Sarm1−/− immediately after the cuts. Data are shown as mean ± SEM; p from one-way ANOVA, wild type n = 16, Sarm1−/− 16. e shows a confocal image of lateralis sensory axons expressing the green-fluorescent calcium sensor CCaMP3 targeted to the endoplasmic reticulum (ER) in wild type (left column) and Sarm1−/− fish (right column). Rows show that same samples before laser-mediated transection (top), immediately after transection (middle), and 60 s after transection (bottom). f Quantification ER calcium influx shows strong and statistically equal elevation and decay in wild type and Sarm1−/− after the cuts. Data are shown as mean ± SEM; p from one-way ANOVA, wild type n = 16, Sarm1−/− 16.
|