|
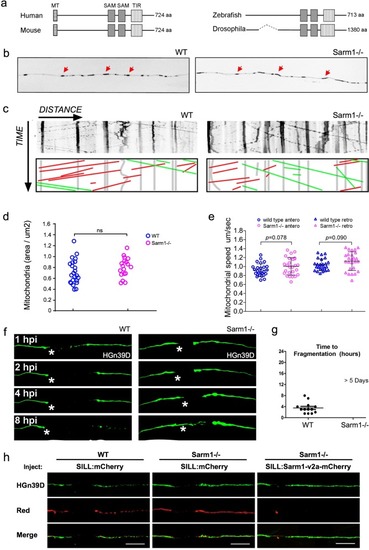
Functional conservation of Sarm1 in zebrafish.a Structure Sarm1 indicating alignment of the Sarm1 functional domains from different species (not at scale). b Confocal image of axonal mitochondria marked with mito-mCherry in wild type and Sarm1−/−. Red arrows point to prominent mitochondrial groups in axons. c Upper panels, kymographs from videomicroscopic recording of axonal mitochondria in wild type (H) (left panel) and Sarm1−/− (I) (right panel). Lower panels show color-coded traces of moving mitochondria in anterograde (green) and retrograde (red) directions, taken from the kymographs shown in the upper panels. d Density of mitochondria in 5 dpf wild type and Sarm1−/−, error bar = SEM. n.s. = not significant, p value from Student’s t-test, n = 25 (WT), n = 19 (Sarm1−/−). e Mobility of the mitochondria in 5 dpf wild type and Sarm1−/−. Circles show the anterograde and triangles the retrograde movement of the mitochondria. p value from one-way ANOVA, wild type n = 26, Sarm1−/− n = 26. f Time-lapse images of axonal degeneration of GFP-labeled lateralis sensory neuron in wild type (left) and Sarm1−/− larvae (right). hpi = hour post-injury, scale bar = 50 μm, white asterisk indicates the regrowing axons from the proximal stump. g Quantification of the time from axon transection to fragmentation in wild type (n = 13) and Sarm1−/− (n = 13). h shows a recue experiment in which the expression of a functional Sarm1 in sensory neurons of Sarm1-mutant fish (right-hand side panels) suffices to degrade severed axons, similarly to wild-type fish (left-hand side panels). Middle panels show non-degradable Sarm1-deficient severed axons.
|