
FIGURE
Fig 9
Fig 9
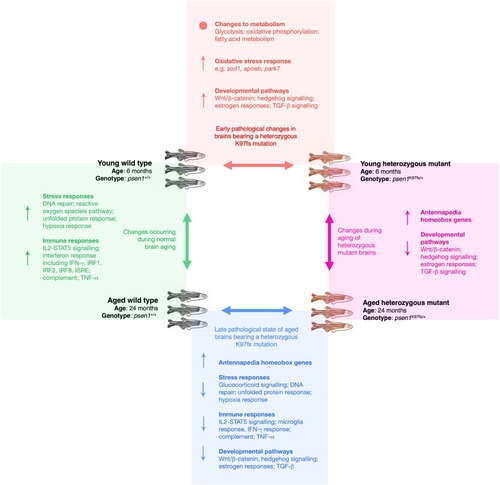
For each of the four pairwise comparisons shown, the summarised molecular changes (↑ = overall increased, ↓ = overall decreased, • = significant alterations but not in an overall direction) were inferred from a combination of the following analyses: functional enrichment analysis of differentially expressed genes and proteins, promoter motif enrichment analysis of differentially expressed genes, gene set enrichment analysis of differentially expressed genes, and weighted co-expression network analysis of the gene expression data. |
Expression Data
Expression Detail
Antibody Labeling
Phenotype Data
Phenotype Detail
Acknowledgments
This image is the copyrighted work of the attributed author or publisher, and
ZFIN has permission only to display this image to its users.
Additional permissions should be obtained from the applicable author or publisher of the image.
Full text @ PLoS One